QGS + QPS
Quantitative Gated and Perfusion SPECT
QGS+QPS provides cardiac function and perfusion quantitation using gated and ungated MPI datasets: ED and ES volumes, ejection fraction, and perfusion measures such as SSS/SRS/SDS and TPD.
QGSTM for Function, QPS for Perfusion
... and more
An interactive stand-alone application for the automatic segmentation, quantification, and analysis of static, gated, and dynamic short axis or transverse myocardial perfusion SPECT.
Quantitative Gated + Perfusion SPECT
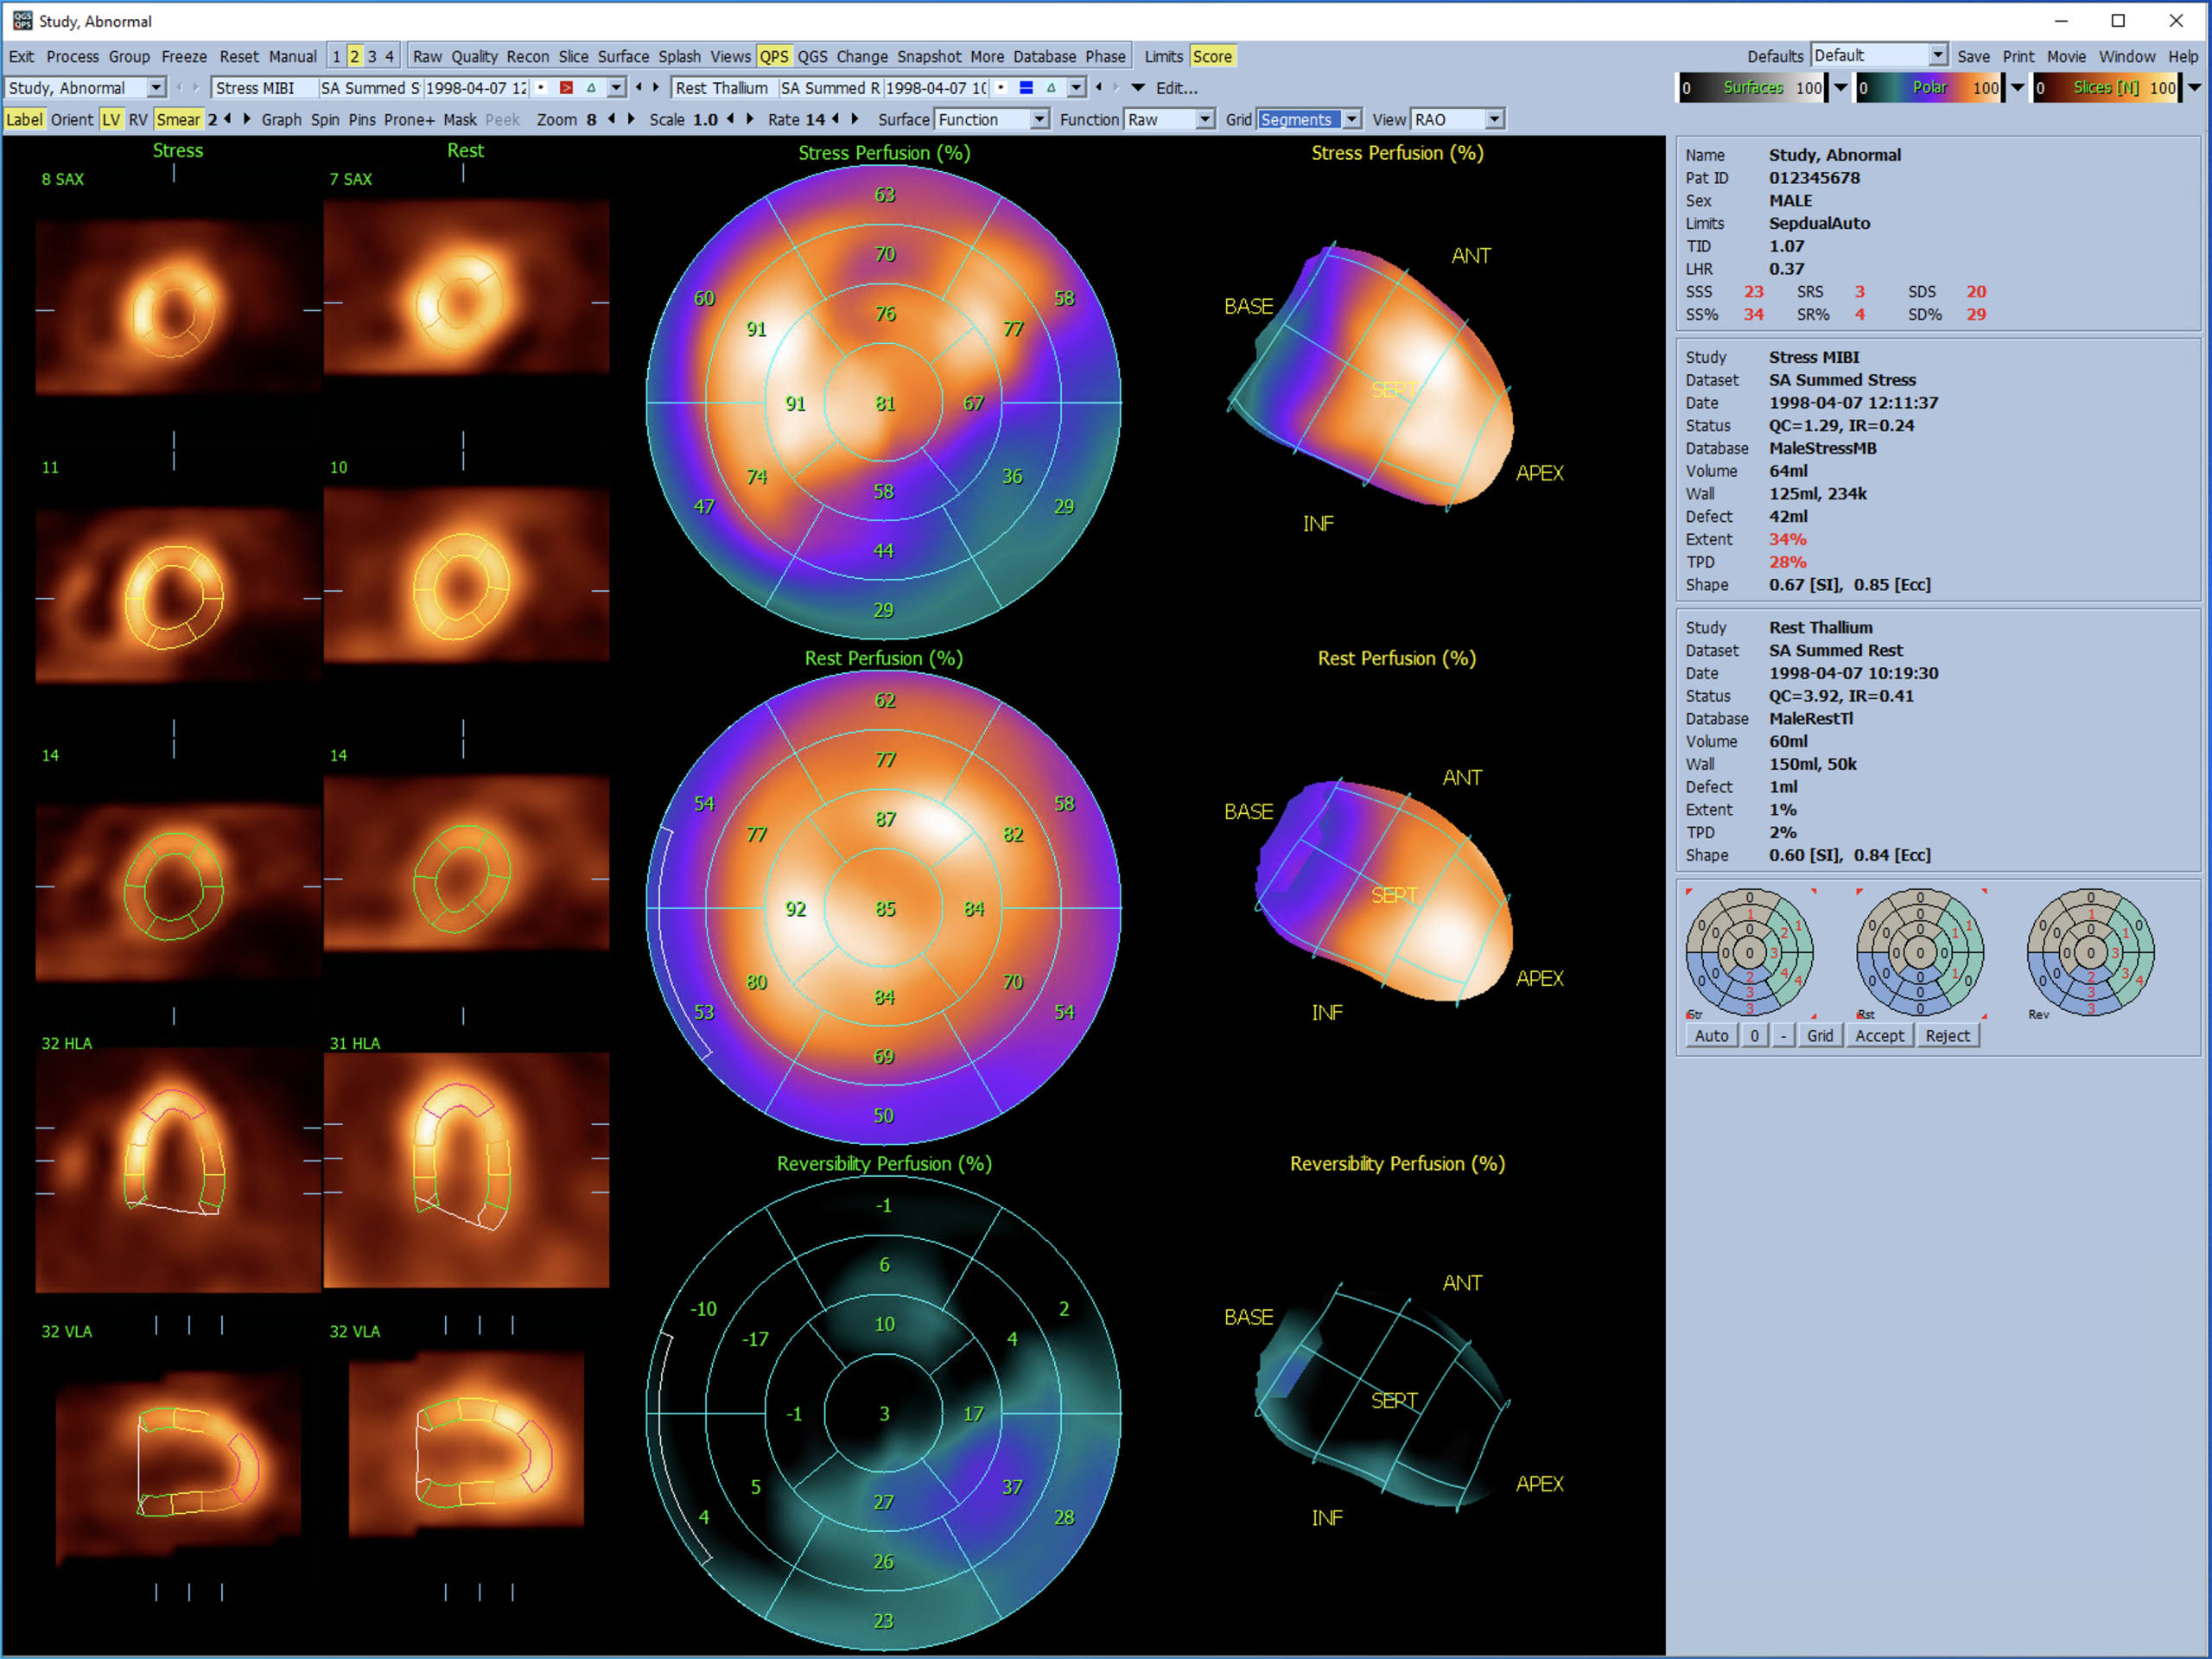
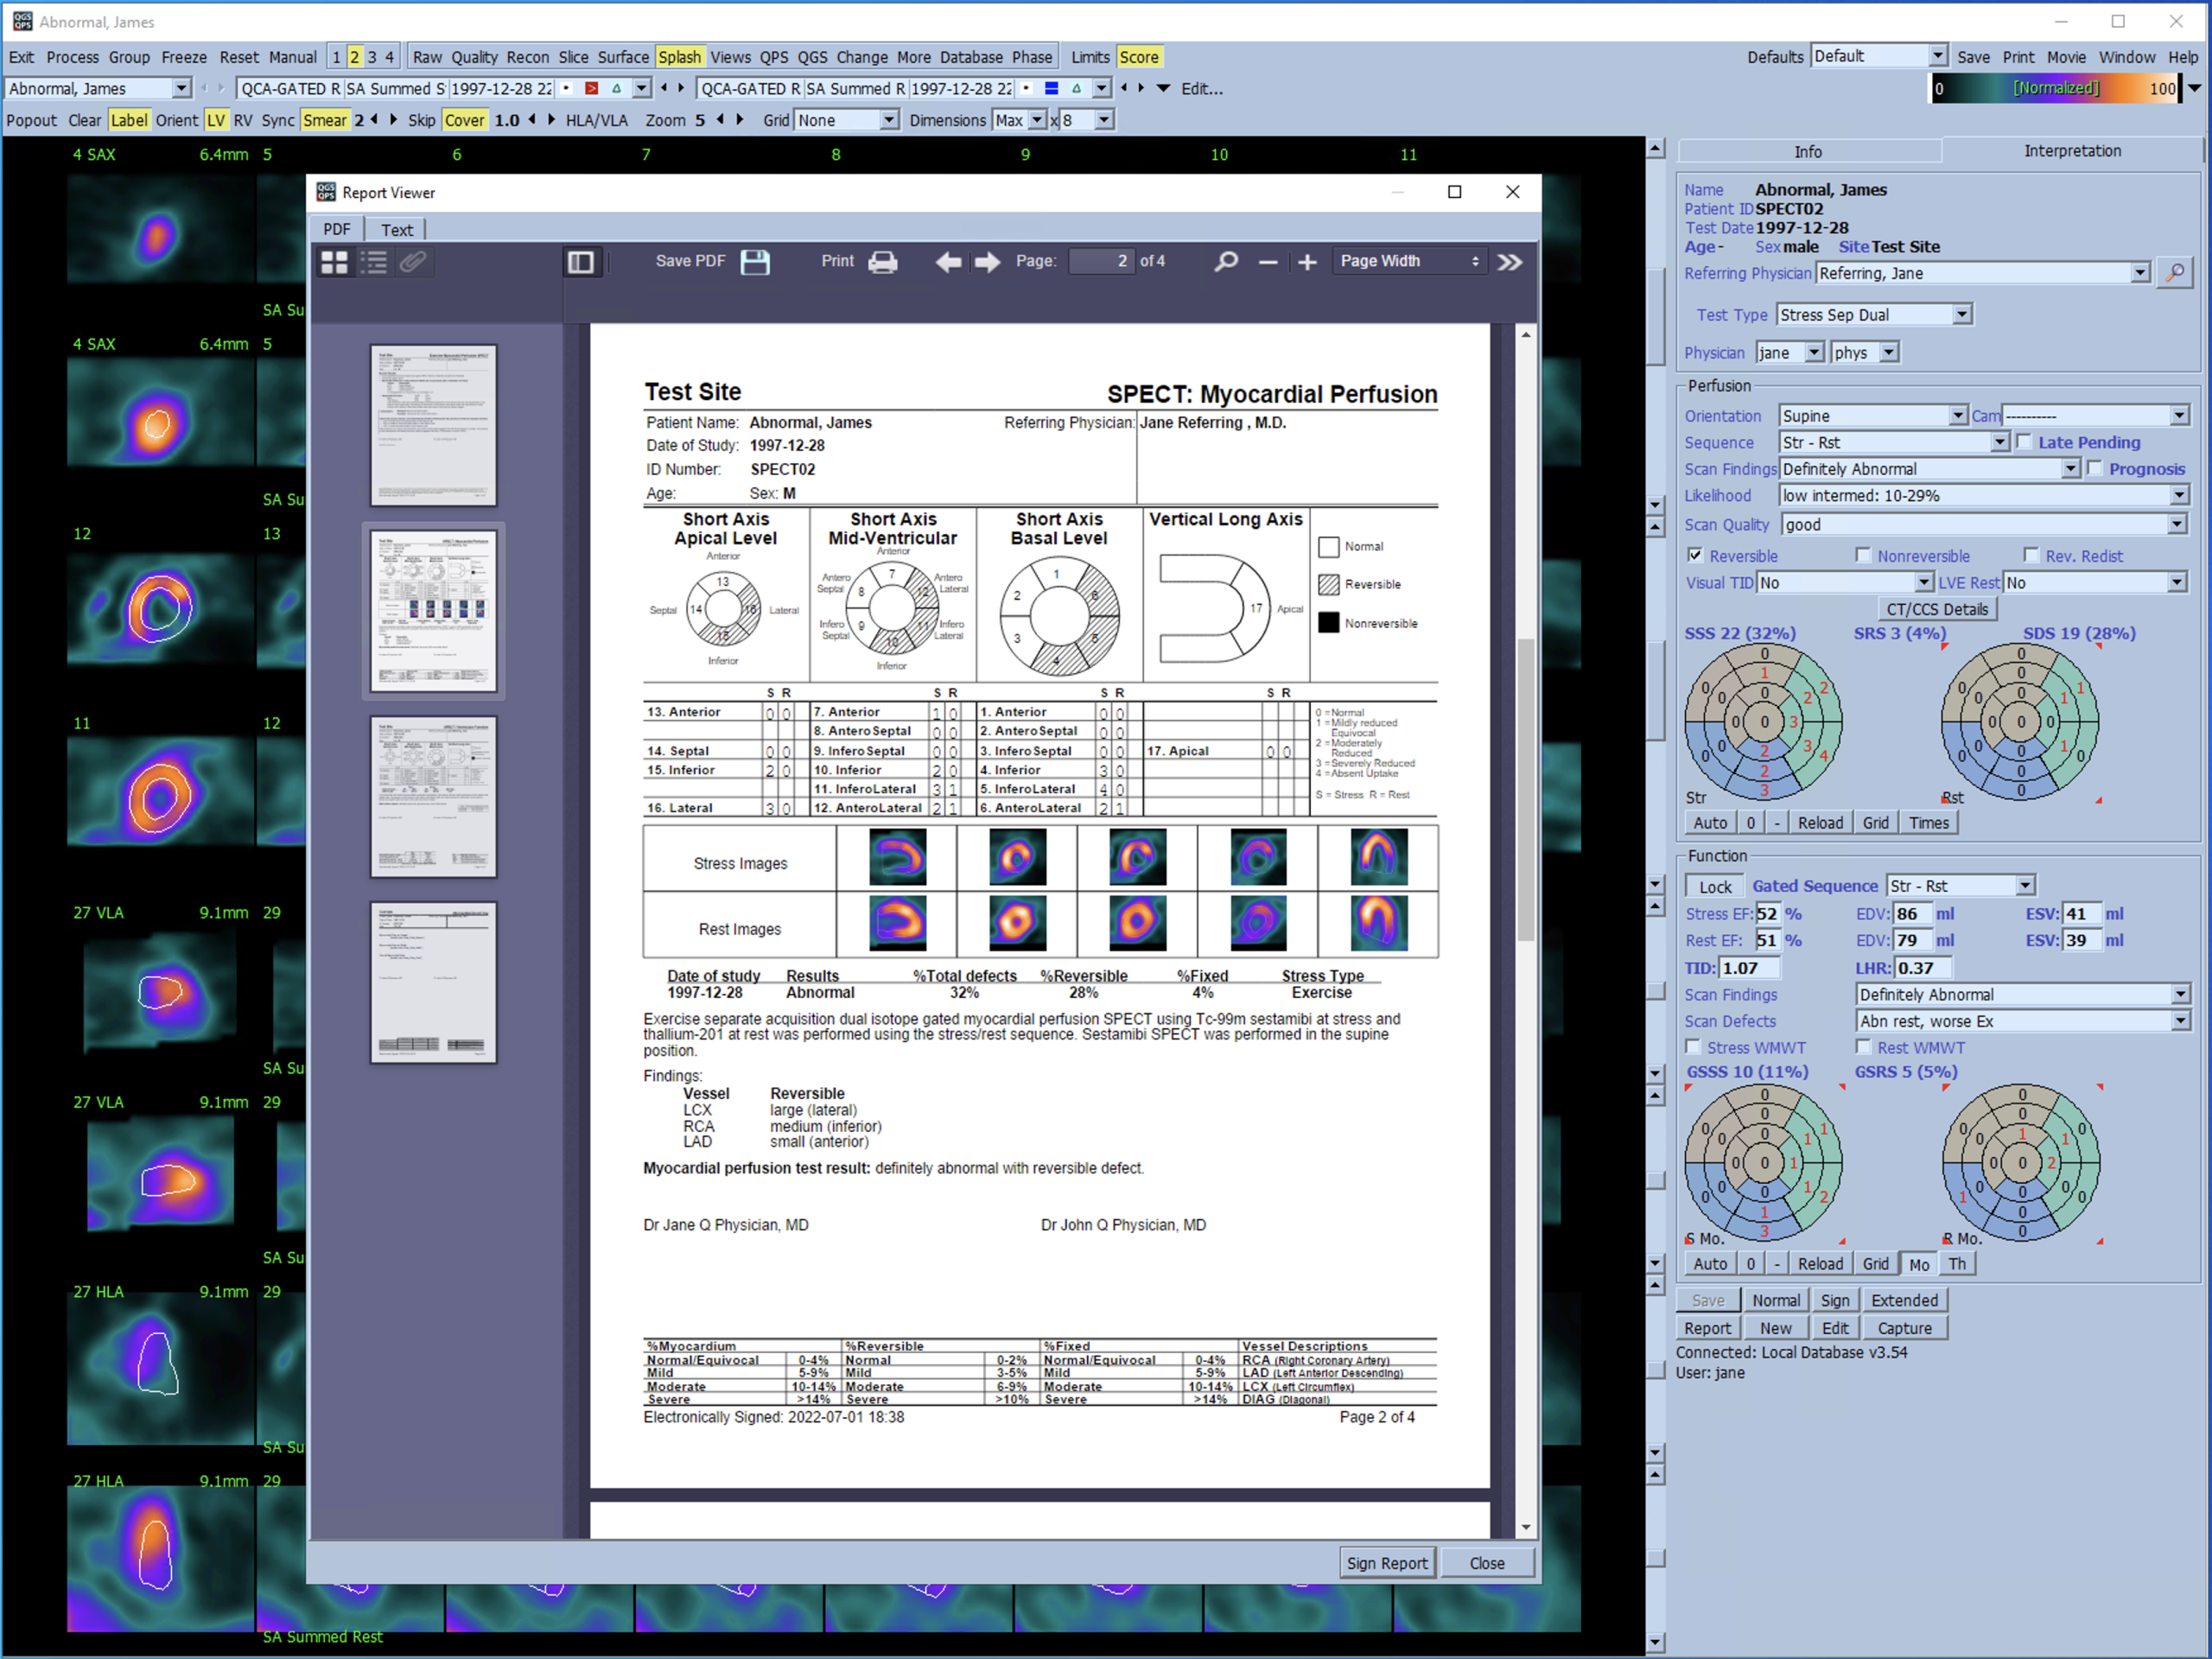
This application provides cardiac function and perfusion quantitation using gated and ungated MPI datasets: ED and ES volumes, ejection fraction, and perfusion measures such as SSS/SRS/SDS and TPD. The image data can be viewed in a variety of modes, from selected slices in a 2D view to a rendered 3D surface of the myocardium with parametric maps (perfusion, motion, thickening and regional EF).
QGS provides the following functionality:
- Automatic generation of left ventricle (LV) inner and outer surfaces and valve plane from three- or four- dimensional (static or gated) LV short axis perfusion SPECT data.
- Generation of quantitative data including LV volume/time curve, ED (end diastolic) volume, ES (end systolic) volume, SV (stroke volume), EF (ejection fraction), mid-myocardial surface area, SMS (summed motion score), STS (summed thickening score), SM% (summed motion percent), and ST% (summed thickening percent).
- Display of stress and rest projection (raw) images in static and cine mode, 2D and 3D display of stress and rest short axis SPECT images in 1 (single), 2 (dual), 3 (triple), or 4 (quadruple) mode. Also display of screen capture images (also known as snapshots).
- Automatic generation of surfaces and polar maps, which display in parametric fashion the pattern of motion and thickening of the LV using normal limits.
- Gated short axis datasets with associated LV contours will have its diastolic function automatically computed from the time-volume curve and generating PER Peak Emptying Rate (ml/s), PFR Peak Filling Rate (ml/s), MFR/3 Mean Filling Rate for first third of cardiac cycle following end diastole (ml/s), TTPF Time To Peak Filling (intervals)
- All categorical polar maps and polar map and functional surface overlays in QGS and QPS is available in the 20 segment format and in the AHA standard 17 segment format. 17 segment format categorical scores will be able to be automatically generated using either 17 or 20 segment using motion and thickening databases.
- Any gated short axis datasets with associated LV contours will have the eccentricity of its mid-myocardial wall for each interval automatically computed, and expressed as an "eccentricity index". It will be displayed in the QGS Information Box as ECC, and will have values between 0 (sphere) and 1 (line).
(may not be in all versions)
- Prone/Supine combined imaging has been a hallmark of the Cedars-Sinai approach for a decade, improving observer confidence. Prone-supine quantification allows a single measurement to be reported, representing the combination of prone and supine quantifications. This has been documented to improve the accuracy of SPECT interpretation over supine interpretation alone. The clinicians at Cedars-Sinai use this tool on every patient with questionable findings.
- Motion Frozen generates an ungated image from gated by “warping” all frames of ECG-gated images to the end-diastolic position. Such "motion-frozen" perfusion and viability images have improved resolution and contrast since the blurring effect of cardiac motion is removed.
- Phase toggle gives access to information regarding the synchrony of contraction from gated myocardial perfusion SPECT images, and can be of importance in assessing the likelihood of a patient benefiting from the growing procedure of cardiac resynchronization therapy (CRT).
- Shape Index defines 3D left ventricular (LV) geometry derived from LV contours in end systolic and end diastolic phases. It's the ratio between the maximum dimension of the LV in all short-axis planes and the length of the mid-ventricular long axis and has been shown to improve the identification of left ventricular failure.
- The PowerPoint feature provides the ability to save results and application configuration for case studies, allowing fast and easy launching directly from a PowerPoint slide, excellent for presentations and demonstrations.
- Integration of ARG (Automated Report Generator) within QGS for reporting functionality.
Request A Quote
Interested in purchasing the Cedars-Sinai Cardiac Suite?
Fill out a Quote Request
Call +1-844-CSMC-AIM
(844-276-2246), press 1 for Sales
Email sales@csaim.com