The Cardiac Suite
You know our software as QGSTM, AutoQUANTTM, and AutoSPECTTM—to name but a few. We have been licensing these applications to companies like GE, Philips, and Siemens for over 20 years. Now they’re available directly from us as The Cardiac Suite.
QGS+QPS - Quantitative Gated + Perfusion SPECT
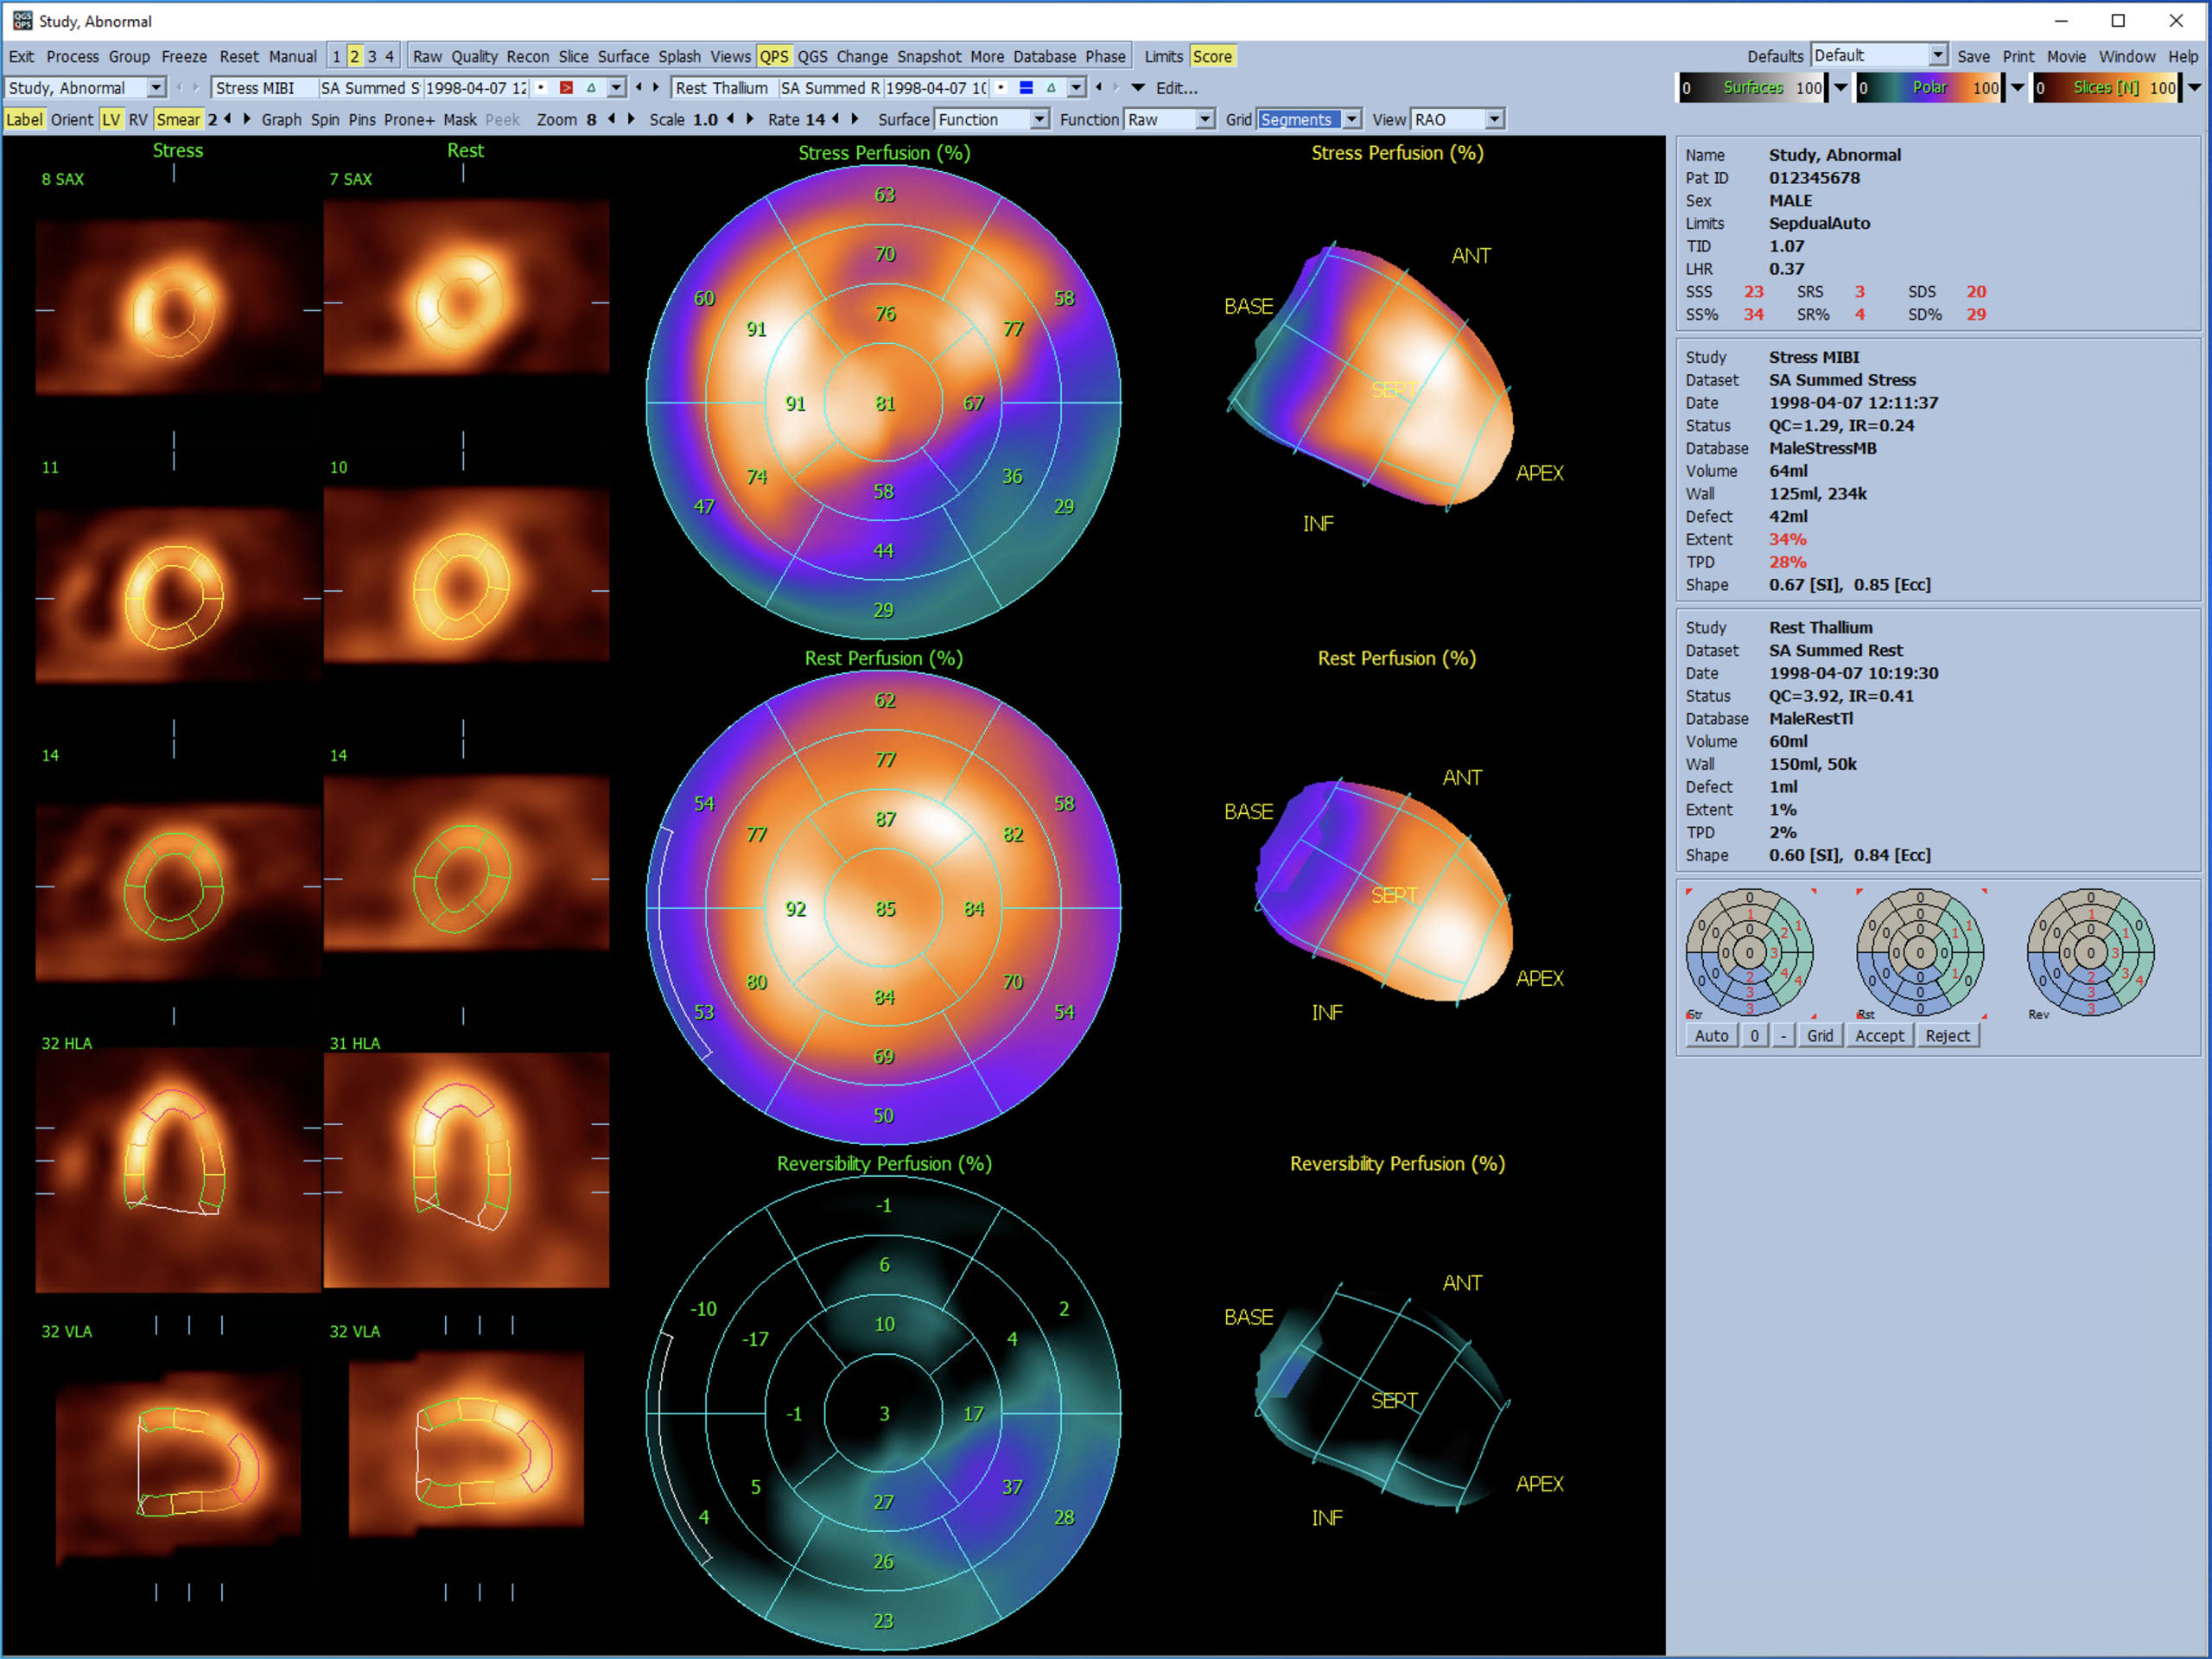
Also known as AutoQUANT™ on Philips platforms, this application provides cardiac function and perfusion quantitation using gated, ungated, and optionally dynamic MPI datasets: ED and ES volumes, ejection fraction, perfusion measures such as SSS/SRS/SDS and TPD, and MBF/MFR flow measurements. The image data can be viewed in a variety of modes, from selected slices in a 2D view to a rendered 3D surface of the myocardium with parametric maps (perfusion, motion, thickening and regional EF).
An interactive stand-alone application for the automatic segmentation, quantification and analysis of static and gated short axis myocardial perfusion SPECT.
QGS+QPS provides the following functionality:
- Automatic generation of left ventricle (LV) inner and outer surfaces and valve plane from three- or four- dimensional (static or gated) LV short axis perfusion SPECT data.
- Generation of quantitative data including LV volume/time curve, ED (end diastolic) volume, ES (end systolic) volume, SV (stroke volume), EF (ejection fraction), mid-myocardial surface area, SMS (summed motion score), STS (summed thickening score), SM% (summed motion percent), and ST% (summed thickening percent).
- Display of stress and rest projection (raw) images in static and cine mode, 2D and 3D display of stress and rest short axis SPECT images in 1 (single), 2 (dual), 3 (triple), or 4 (quadruple) mode. Also display of screen capture images (also known as snapshots).
- Automatic generation of surfaces and polar maps, which display in parametric fashion the pattern of motion and thickening of the LV using normal limits.
- Gated short axis datasets with associated LV contours will have its diastolic function automatically computed from the time-volume curve and generating PER Peak Emptying Rate (ml/s), PFR Peak Filling Rate (ml/s), MFR/3 Mean Filling Rate for first third of cardiac cycle following end diastole (ml/s), TTPF Time To Peak Filling (intervals)
- All categorical polar maps and polar map and functional surface overlays in QGS and QPS is available in the 20 segment format and in the AHA standard 17 segment format. 17 segment format categorical scores will be able to be automatically generated using either 17 or 20 segment using motion and thickening databases.
- Any gated short axis datasets with associated LV contours will have the eccentricity of its mid-myocardial wall for each interval automatically computed, and expressed as an "eccentricity index". It will be displayed in the QGS Information Box as ECC, and will have values between 0 (sphere) and 1 (line).
(may not be in all versions)
- Prone/Supine combined imaging has been a hallmark of the Cedars-Sinai approach for a decade, improving observer confidence. Prone-supine quantification allows a single measurement to be reported, representing the combination of prone and supine quantifications. This has been documented to improve the accuracy of SPECT interpretation over supine interpretation alone. The clinicians at Cedars-Sinai use this tool on every patient with questionable findings.
- Motion Frozen generates an ungated image from gated by “warping” all frames of ECG-gated images to the end-diastolic position. Such "motion-frozen" perfusion and viability images have improved resolution and contrast since the blurring effect of cardiac motion is removed.
- Phase toggle gives access to information regarding the synchrony of contraction from gated myocardial perfusion SPECT images, and can be of importance in assessing the likelihood of a patient benefiting from the growing procedure of cardiac resynchronization therapy (CRT).
- Shape Index defines 3D left ventricular (LV) geometry derived from LV contours in end systolic and end diastolic phases. It's the ratio between the maximum dimension of the LV in all short-axis planes and the length of the mid-ventricular long axis and has been shown to improve the identification of left ventricular failure.
- The PowerPoint feature provides the ability to save results and application configuration for case studies, allowing fast and easy launching directly from a PowerPoint slide, excellent for presentations and demonstrations.
- Integration of ARG (Automated Report Generator) within QGS for reporting functionality.
QPET - Quantitative PET
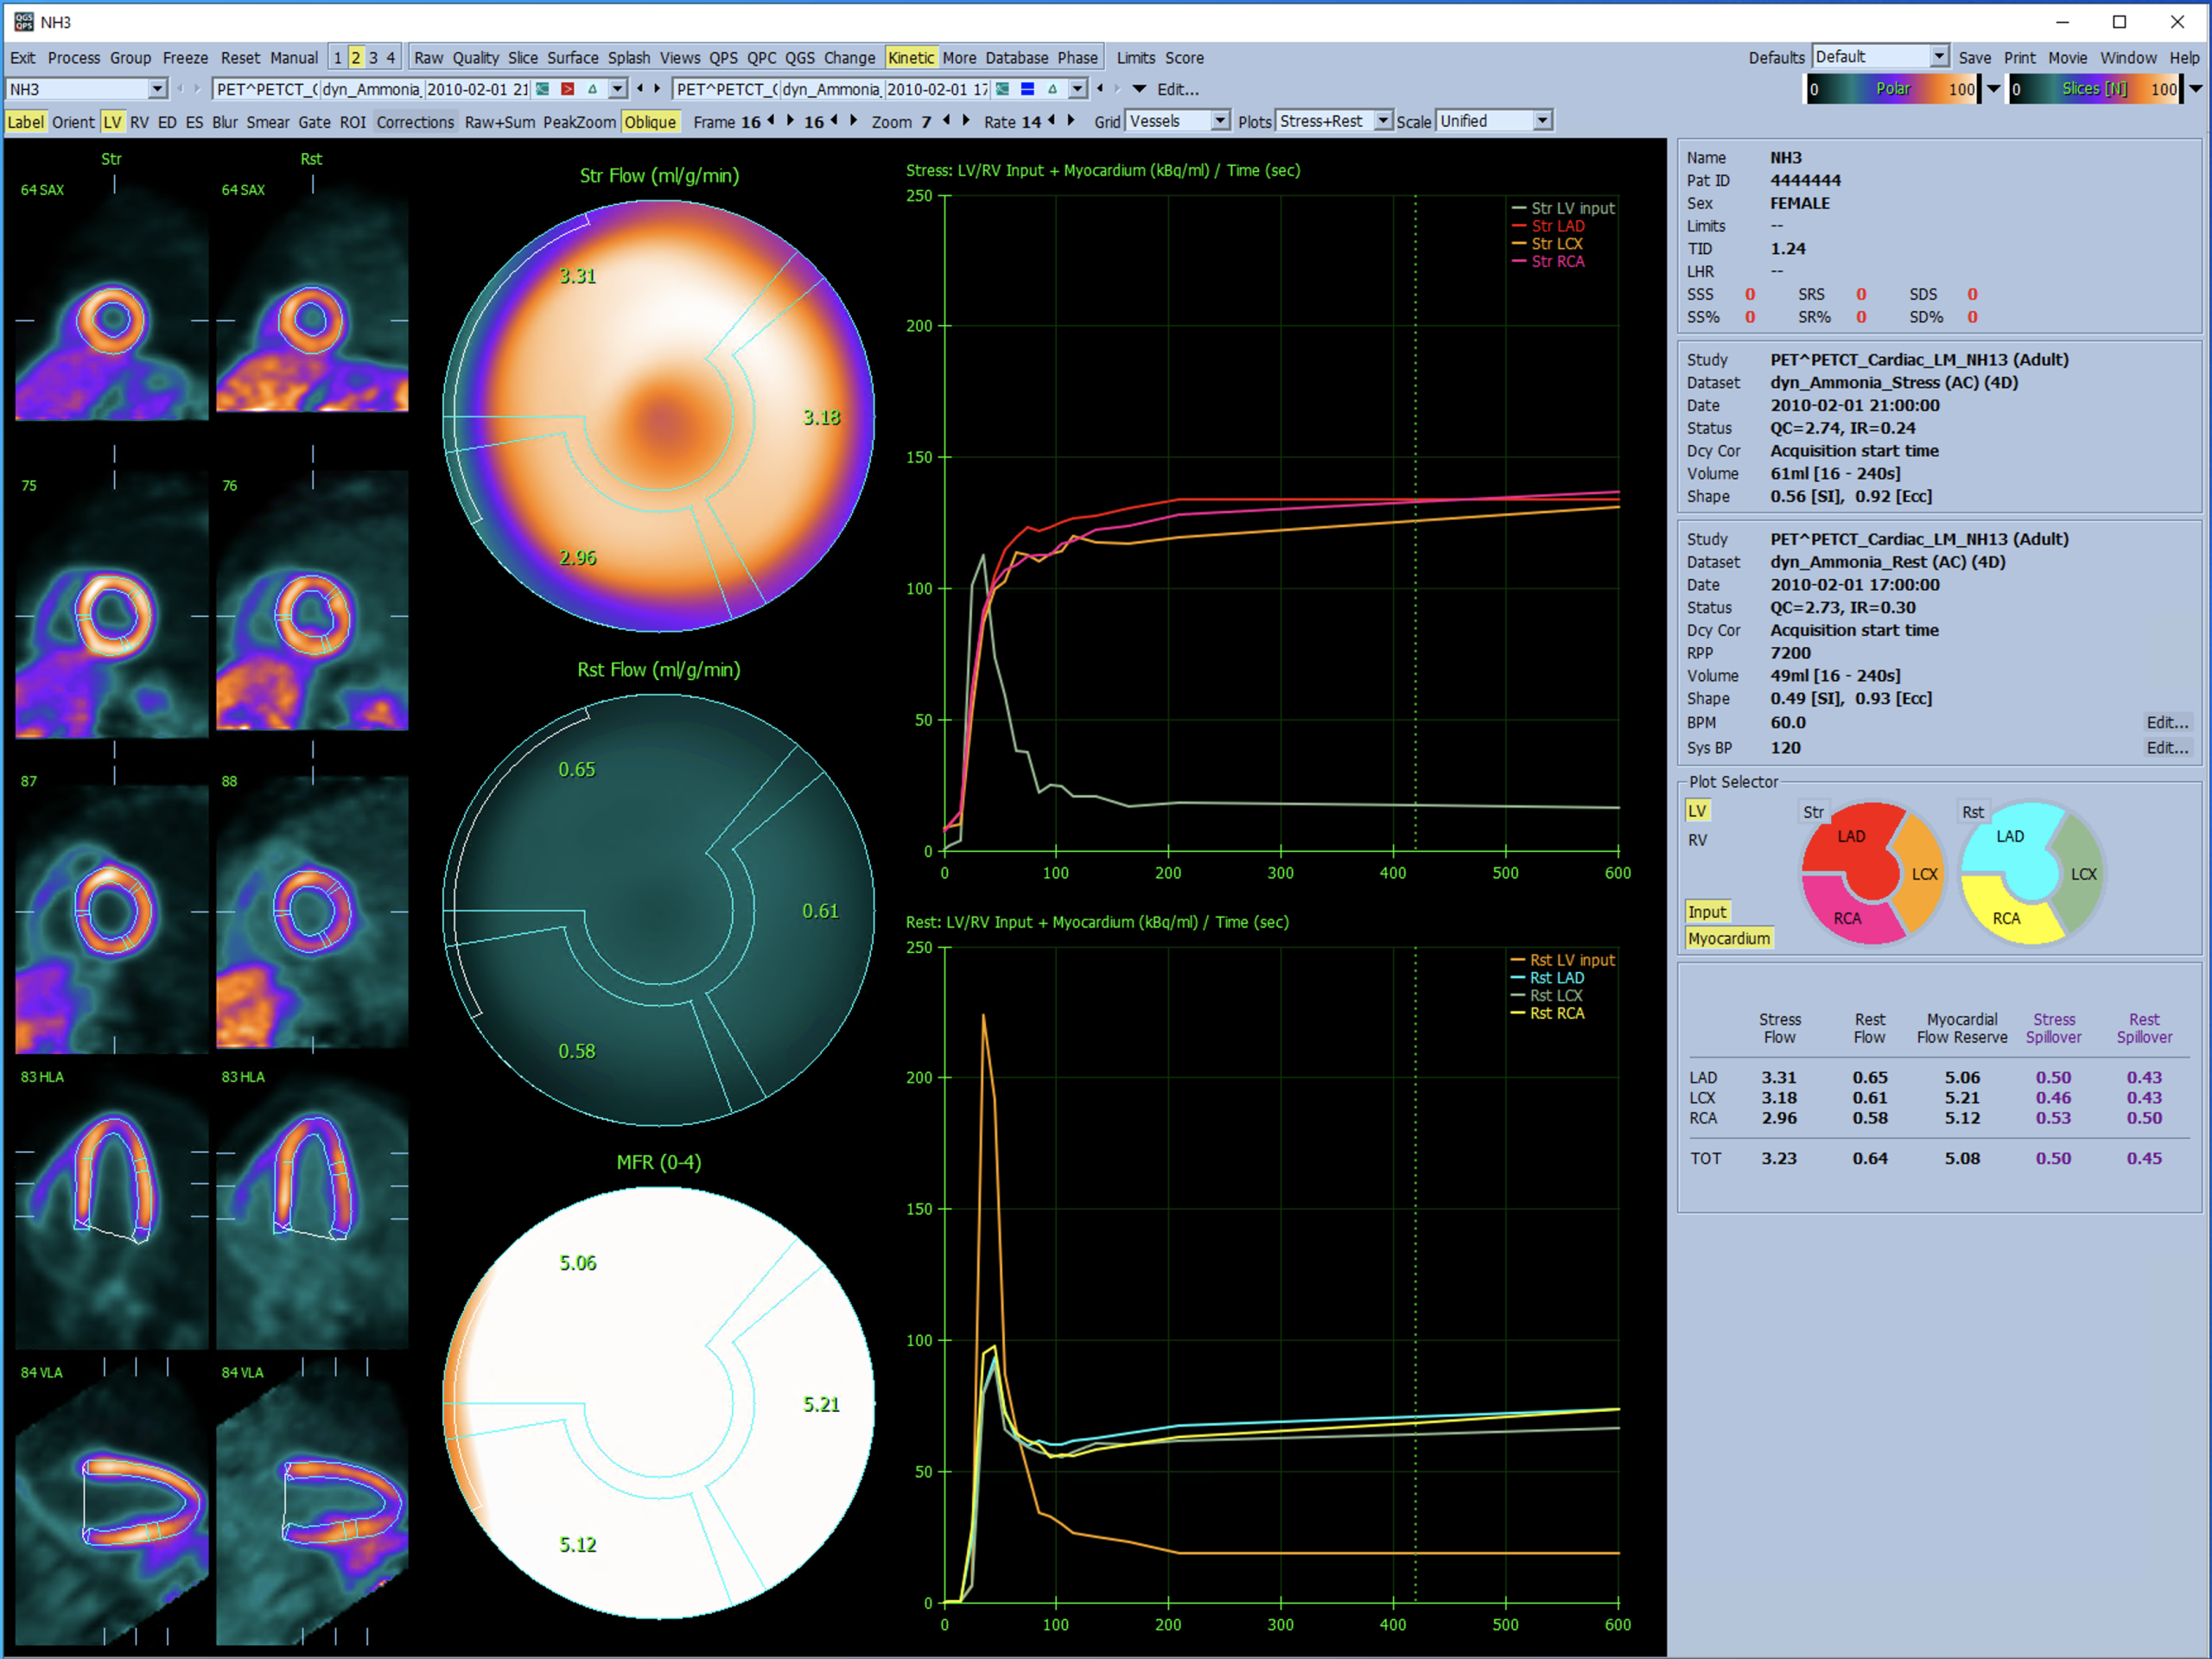
The new PET Kinetics module provides the calculation of Myocardial Flow Reserve (MFR) and Myocardial Blood Flow (MBF).
This application also provides automatic segmentation, quantification and analysis of static, gated, and dynamic myocardial perfusion PET, with support for both short axis and transverse datasets.
An interactive stand-alone application for the automatic segmentation, quantification and analysis of static and gated myocardial perfusion PET, with support for both short axis and transverse datasets. It utilizes and integrates all of the features available in QGS and QPS.
PET Perfusion Databases created from scans of low-likelihood patients enables normal-limit based quantification of Rb-82 and N-13-ammonia perfusion PET images. Segmental stress and rest perfusion scores can be obtained using the familiar 17- or 20- segment models. Attenuation corrected PET/CT Rb-82 and N-13-ammonia normal limits are provided with QPET. These normal PET/CT databases have separate stress and rest files and combine data from both genders presenting no differences after attenuation correction.
The QPS and QGS contour algorithms have been optimized specifically for transverse PET data, providing a more reliable approach to identifying the heart and valve plane. This also includes an enhanced manual mode allowing reorienting of the transverse data. Once transverse data has been processed, it can be instantly reoriented to the standard short axis views associated with perfusion imaging for consistency in interpreting results.
Viability Quantification assess "hibernating myocardium" by calculation of relative regional changes between perfusion and viability in areas hypo-perfused on rest. Scar and mismatch parameters are reported as a percentage of the left ventricle. Extent and severity of scar and mismatch are displayed in polar map coordinates or as a 3D surface display. The program allows automatic scoring of scar using the 17- or 20-segment model. Simultaneous display of stress, rest and viability quantification results is possible. Stress images are not required though for the quantification of scar and mismatch.
Myocardial blood flow (MBF) and flow reserve (MFR) can be calculated from dynamic studies. The application allows for manual motion correction, with an upcoming update delivering automated motion correction for improved ease of use and throughput.
QBS - Quantitative Blood Pool SPECT
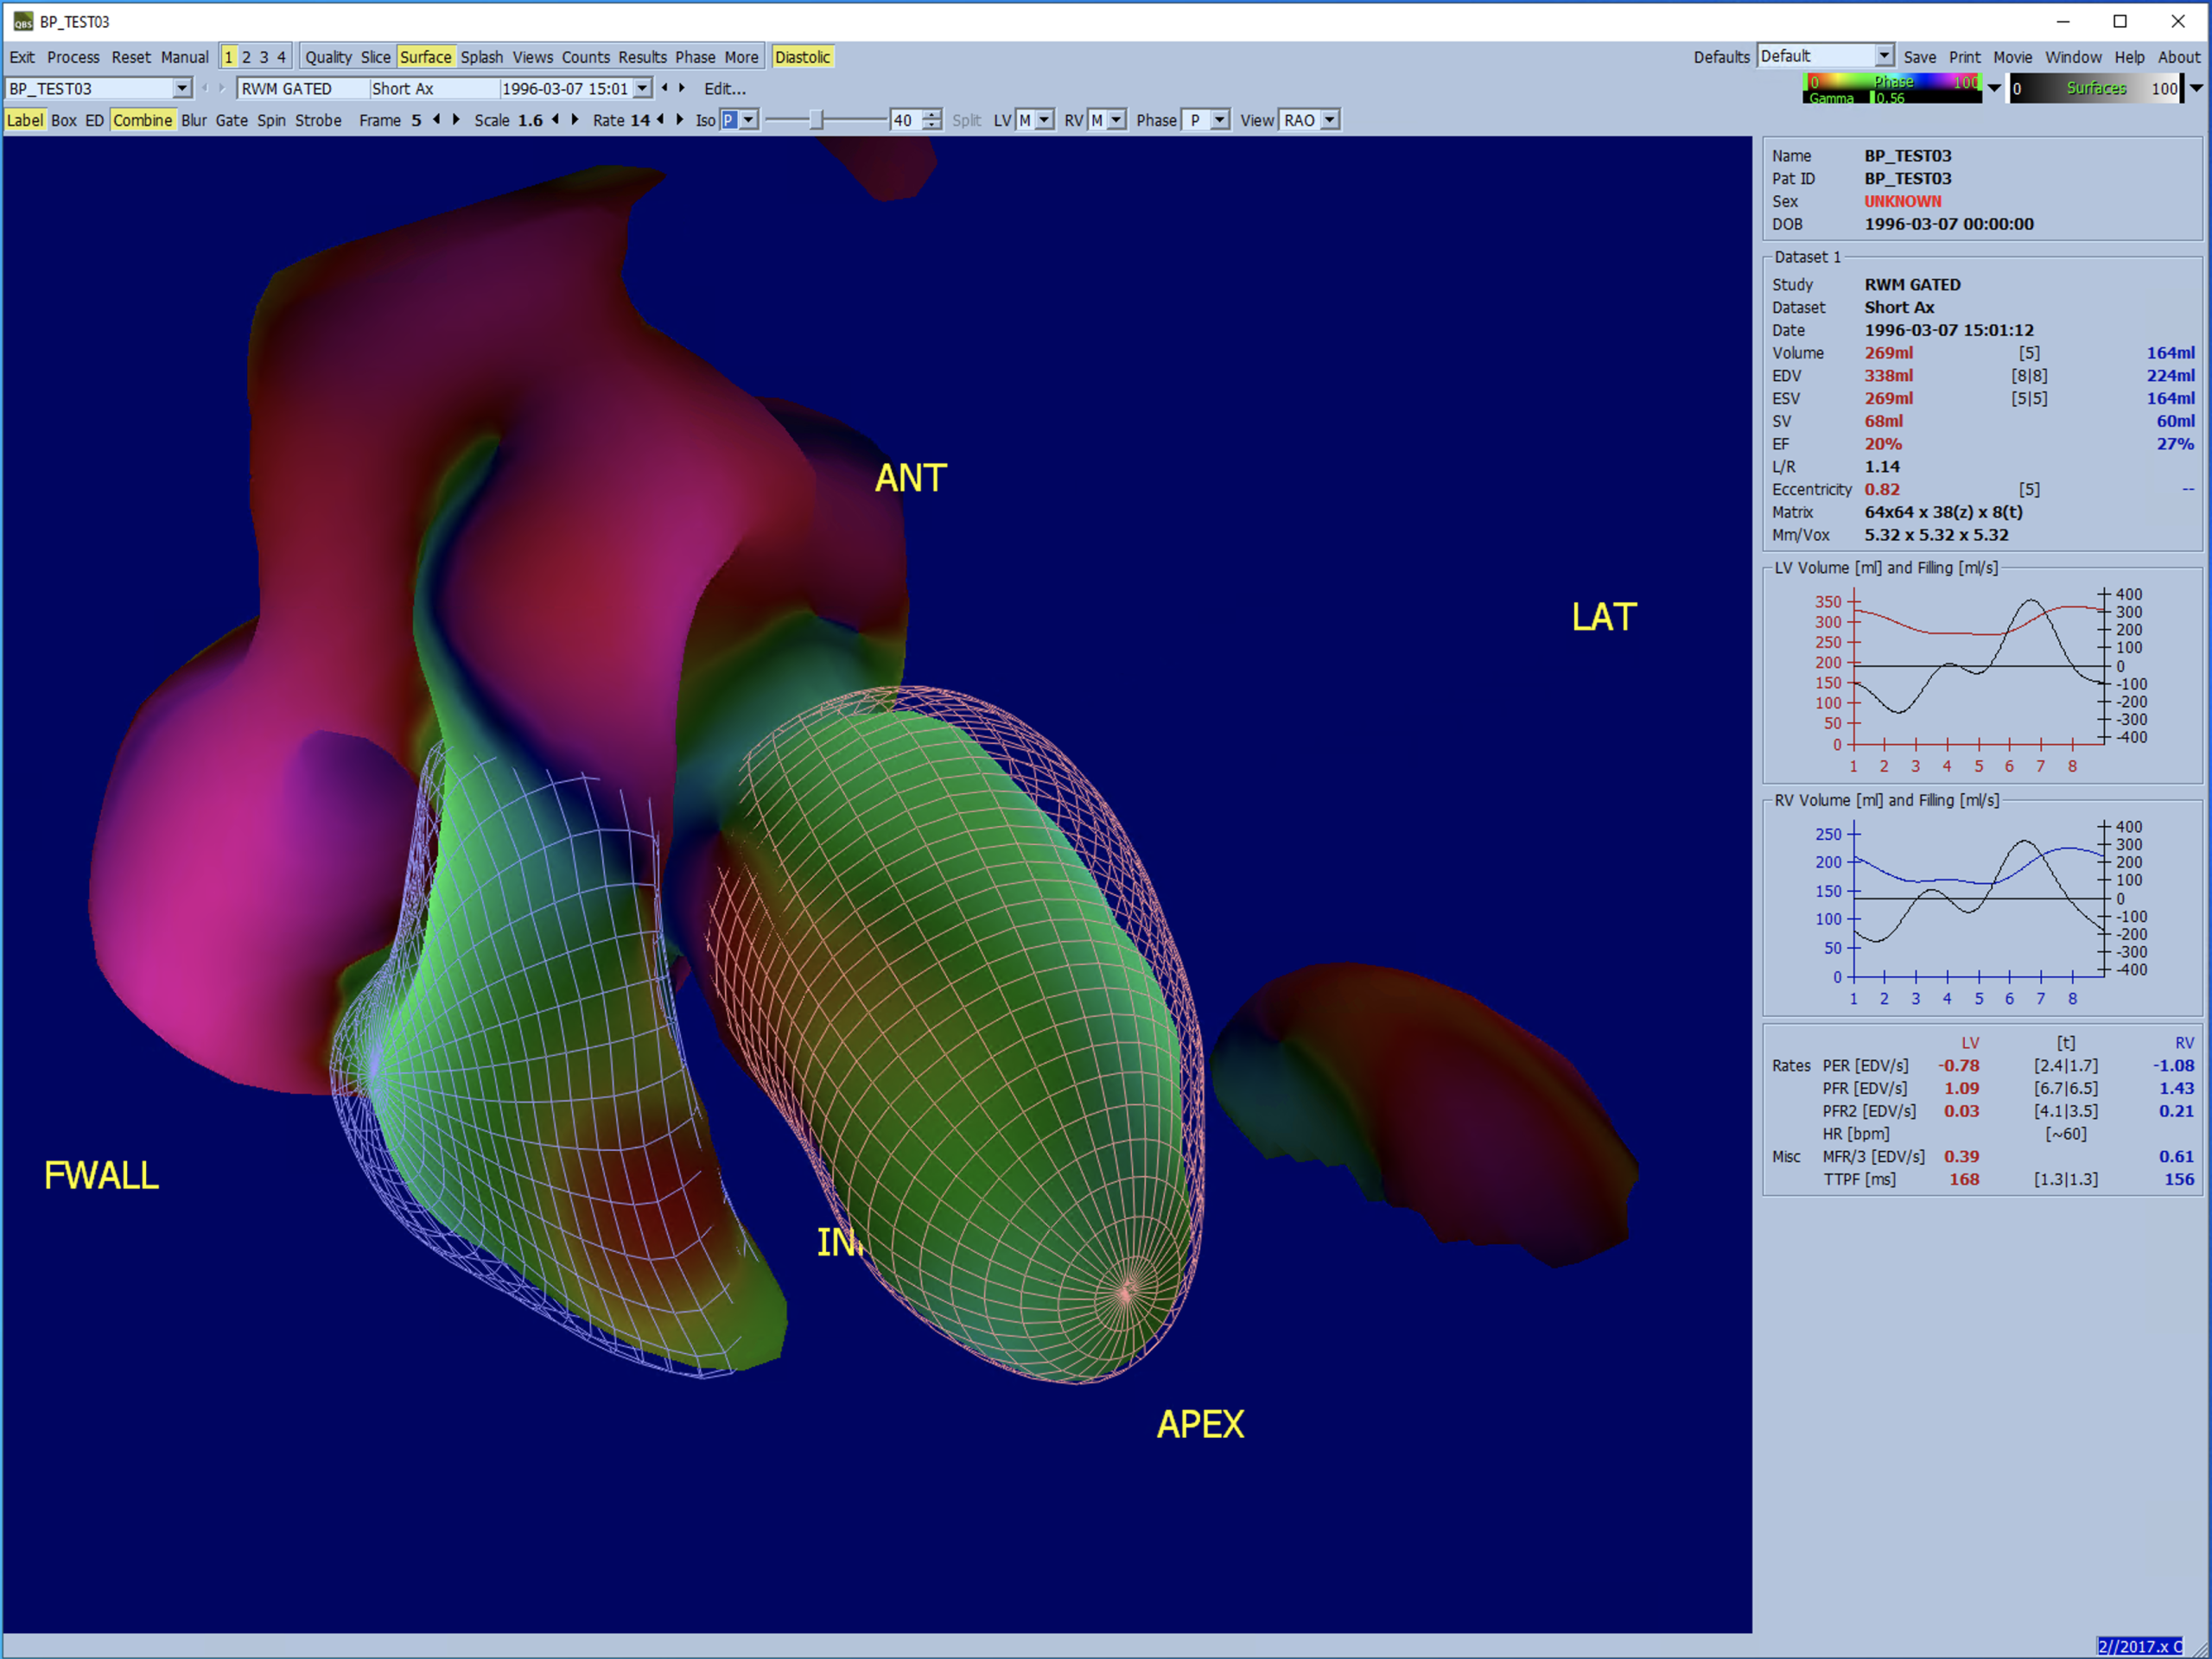
This application provides automatic quantitation of left- and right-ventricular function (ejection fraction, ED and ES volumes, stroke volumes) using gated blood pool SPECT images. It also displays motion polar maps and parametric surfaces, and provides semi-automated processing of planar MUGA studies.
An interactive standalone application for the automatic segmentation and quantification of gated short axis blood pool (red blood cells, RBC), SPECT.
QBS provides the following functionality:
- Automatic generation of left- and right-ventricular endocardial surfaces and valve planes from three-dimensional (3D) gated short axis blood pool images.
- Automatic calculation of left- and right-ventricular volumes and ejection fractions.
- Two-dimensional (2D) image display using standard American College of Cardiology (ACC) cardiac SPECT conventions.
- Display of projection (raw) images in static and cine mode. 2D display and 3D parametric display of gated short axis SPECT images in 1 (single), 2 (dual), 3 (triple), or 4 (quadruple) mode.
- Display of planar images, raw projection images and snapshots (screen captures).
- Ability to support manual identification of the left-ventricular (LV) region, to separate it from the right ventricle (RV).
- Calculation of phase histograms from all gated images, including separate left-ventricular (LV) and right-ventricular (RV) histograms.
- Calculation and display of first Fourier harmonic (FFH) amplitude and phase images for all gated images.
- Computation of diastolic function metrics for the left and right ventricles including PER (peak emptying rate), PFR (peak filling rate), PFR2 (secondary peak filling rate), MFR/3 (mean filling rate over the first third of the ED to ES phase), and TTPF (time to peak filling from ES). HR (heart rate in beats per minute) is also displayed if available.
- Ability to rotate, zoom and cine surfaces.
- Calculation and display of polar maps representing wall motion, including FFH amplitude and phase.
- Regional histogram-based phase calculations with several measures of inter- and intra-ventricular synchrony (mean, mode, standard deviation, full width at 10th of the maximum, and entropy).
ARG - Automated Report Generator
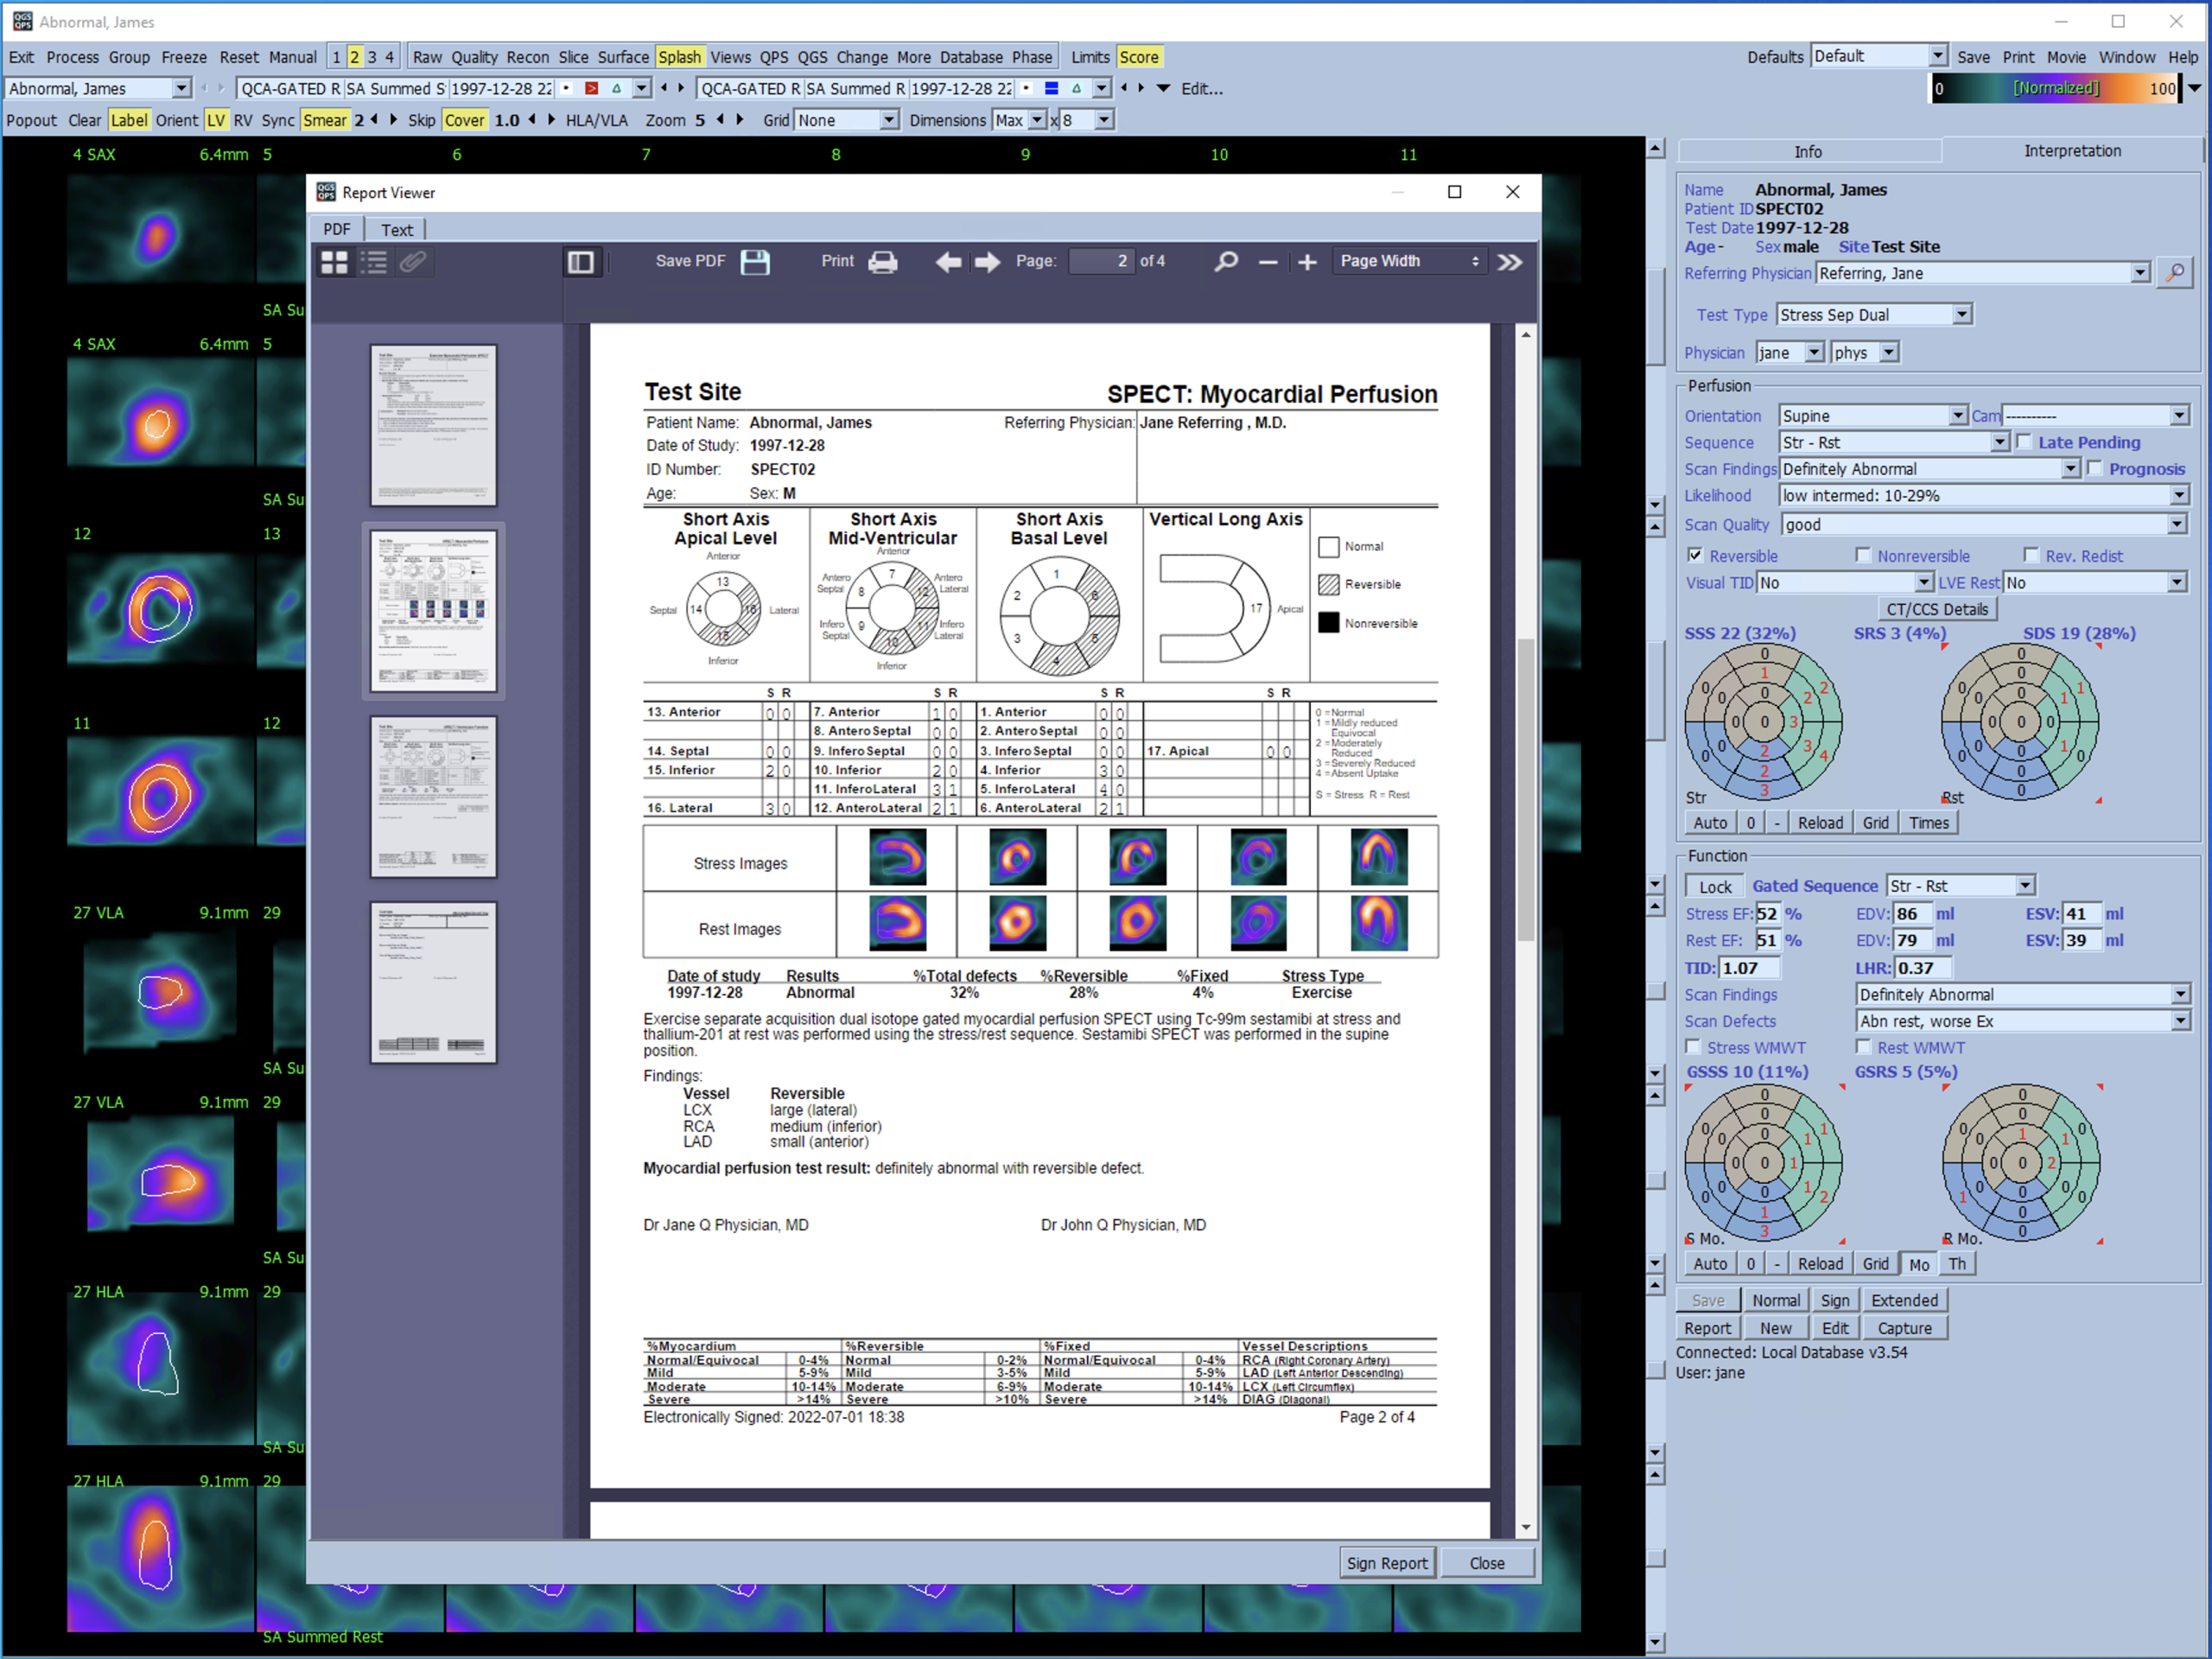
The Cedars-Sinai reporting system can substantially improve the workflow in your nuclear cardiology department. Its two components are Automated Report Generator (ARG) and QARG.
- Easy setup and configuration wizard.
- Fully customizable reports with the aid of a visual report editor.
- Preloaded shortcuts of common sentences and descriptions used in reports and the ability to add new ones.
- A series of consistency checks are used to ensure the report does not contain conflicting information.
- Inclusion of screenshots within the report.
- Utilizing ARG's client server architecture, all physicians, technologists, system administrators and administrative personnel are able to work collaboratively on each patient's study simultaneously.
- Full integration with our myocardial perfusion quantitative applications (AutoQUANT, QPS and QGS) cutting turnaround time and facilitating same-day reporting.
- The system generates an ICANL-compliant report (displays ICANL logo for certified sites).
- The ability to include and edit history and ECG information in the report.
- An interface to allow searching of old reports.
- The ability to generate ASCII Text reports, which can easily be uploaded to HIS/RIS systems.
AutoRecon - SPECT Reconstruction
This application, also known as AutoSPECT™ on Philips platforms, offers several automatic processing modules for single-photon emission computed tomography (SPECT) studies.
AutoRecon offers several automatic processing modules for single-photon emission computed tomography (SPECT) studies. AutoRecon provides the following functionality:
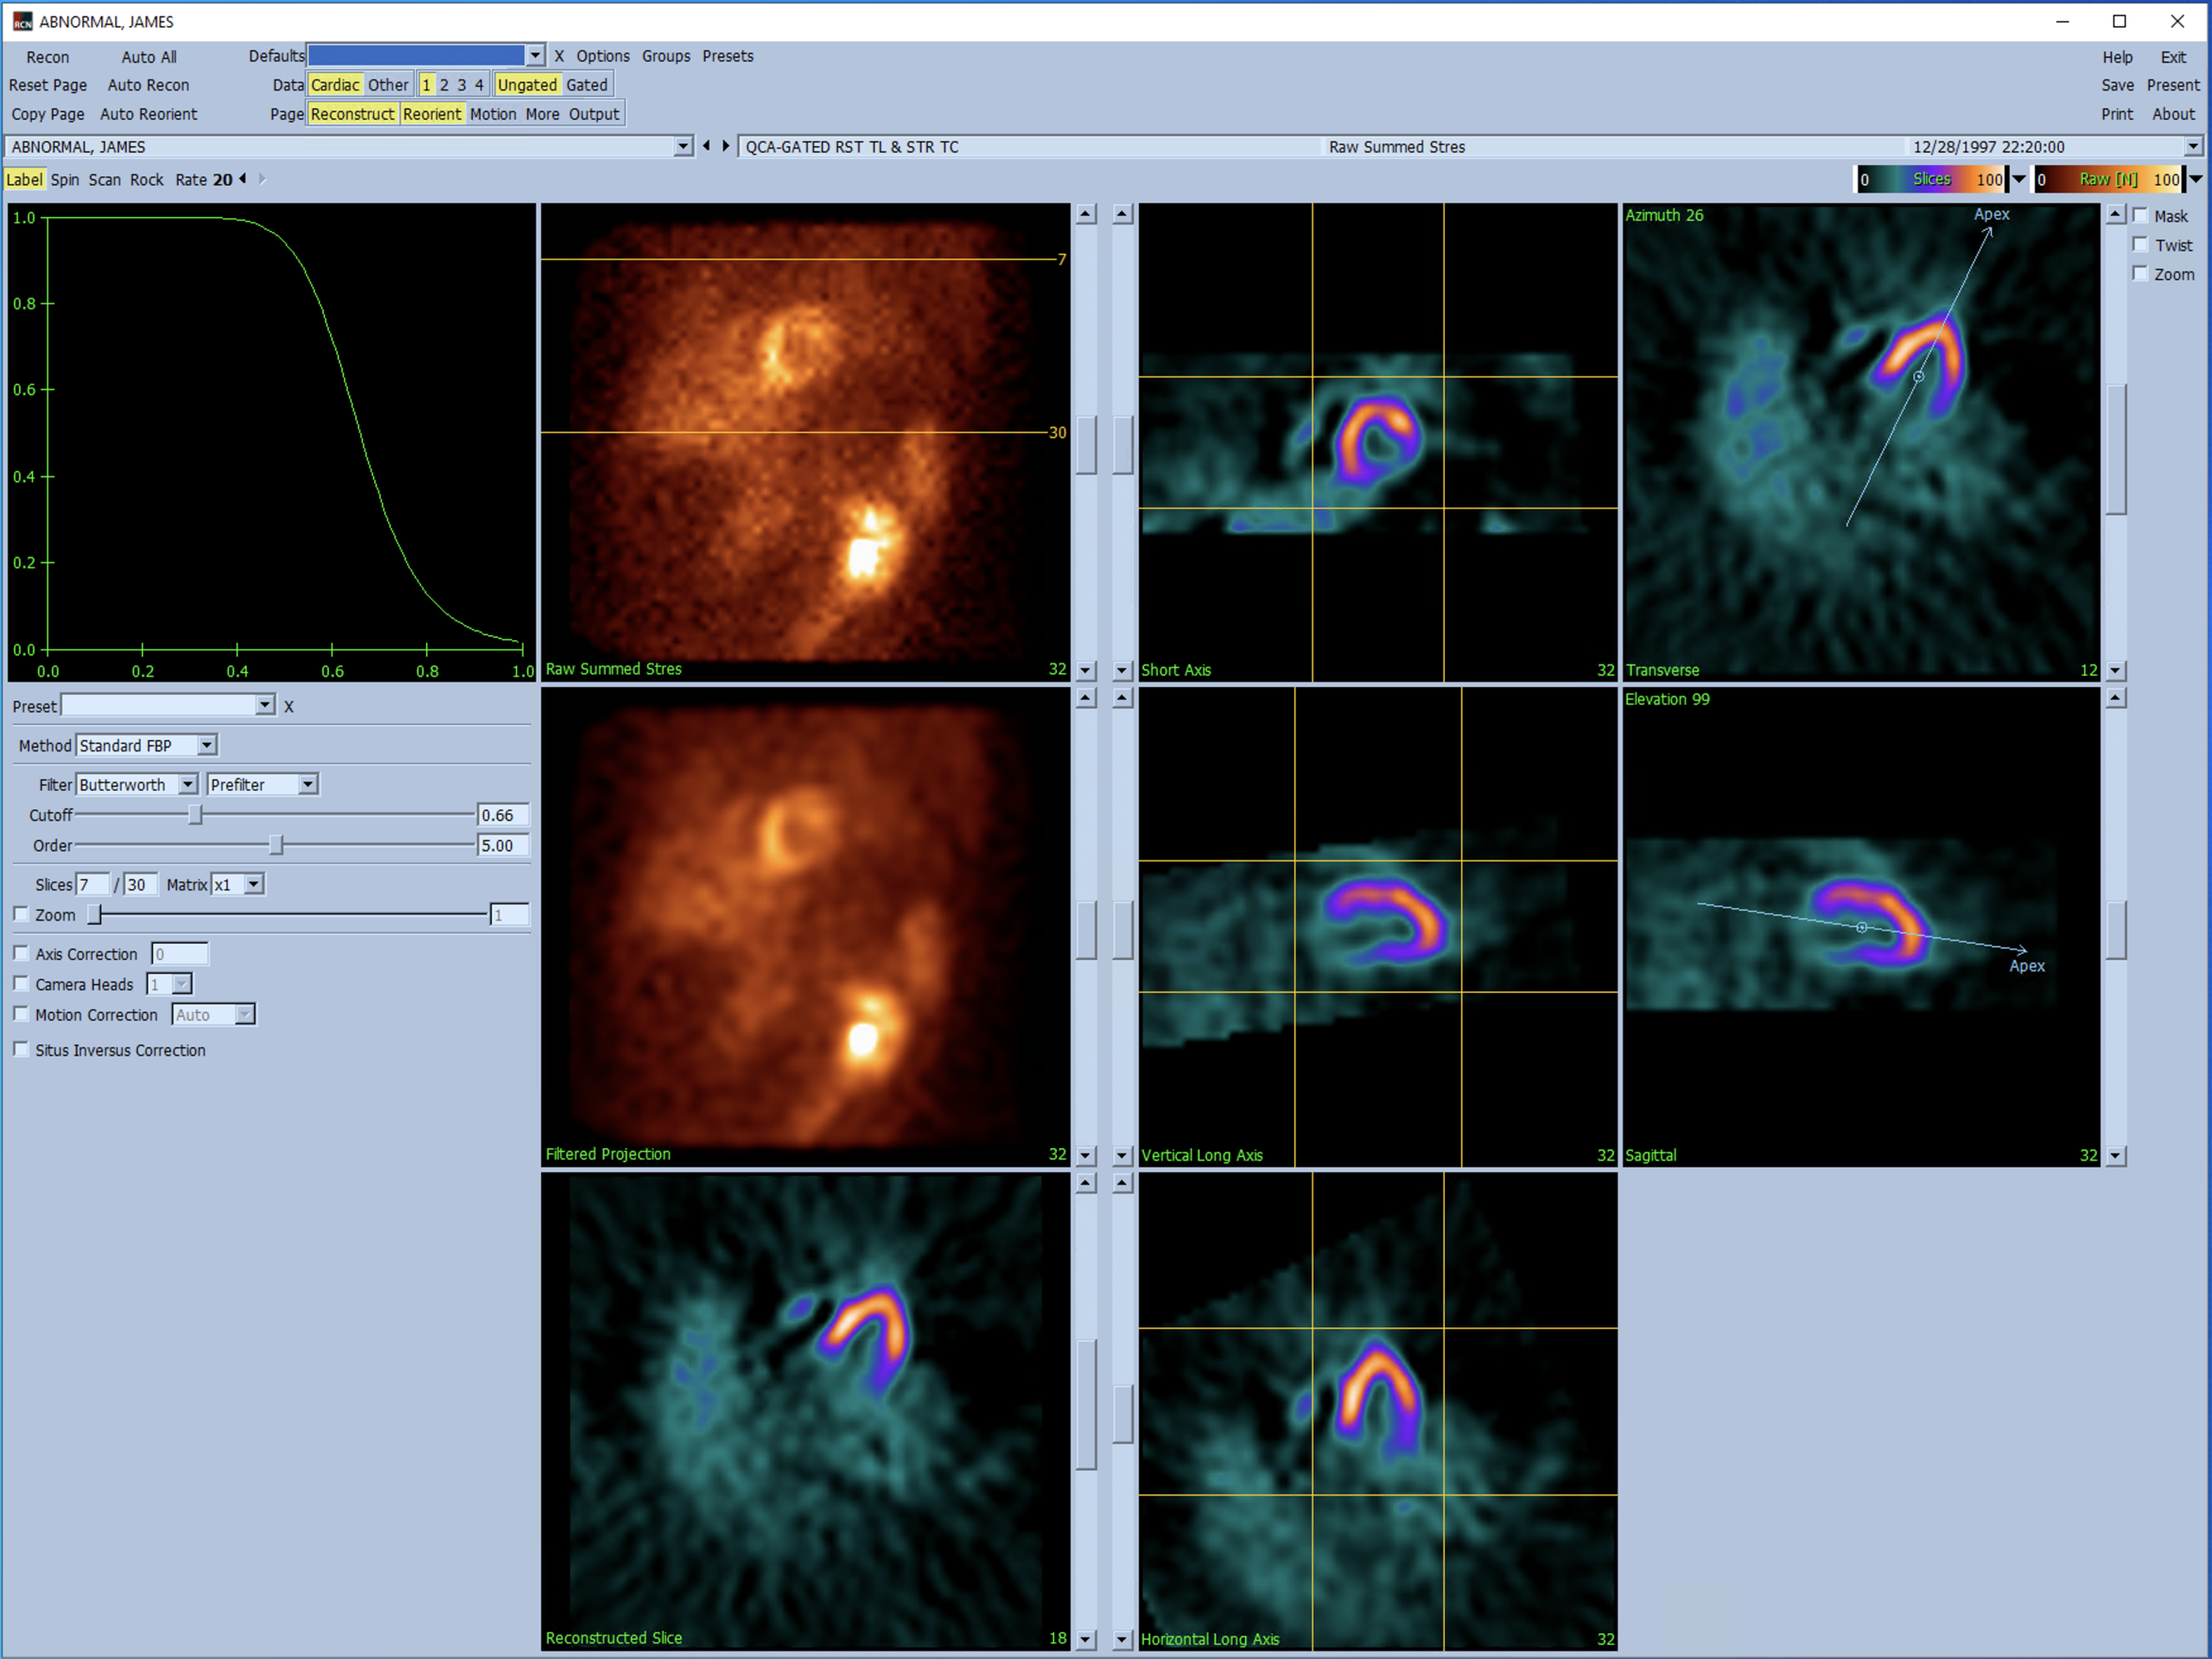
Reconstruction
The purpose of this first module is to reconstruct the data from projections using a variety of algorithms (including iterative reconstruction). The reconstruction page shows the filter and its parameters, as well as the data. From top to bottom: raw projection data, filtered projection data and transverse reconstructed slices.
Reorientation
Once the data has been reconstructed, this module processes transaxial images to reorient them automatically into short-axis (oblique) myocardial perfusion SPECT images.
First, this module determines the extent of the left ventricle, thus limiting subsequent operations to a restricted amount of data. This is done by segmenting the left ventricle by iterative clustering and rule-based location/size/shape criteria.
The final mid-myocardial surface is then determined by an iterative process that incorporates additional constraints of shape and texture and uses information from the nonsegmented transaxial image.
Motion Correction
The motion page presents information in a different manner. Raw projections (corrected and uncorrected) are shown in the top row. The bottom part shows the sinogram and the correction control window.
Each row in the sinogram corresponds to a projection in the original raw data. The pixel values in the sinogram for a particular row are the values of the voxels located along the intersection of the chosen transverse plane and raw projection plane.
MoCo - Motion Correction

This application provides automatic and manual correction of SPECT acquisition artifacts.
CSI - Image Database Manager
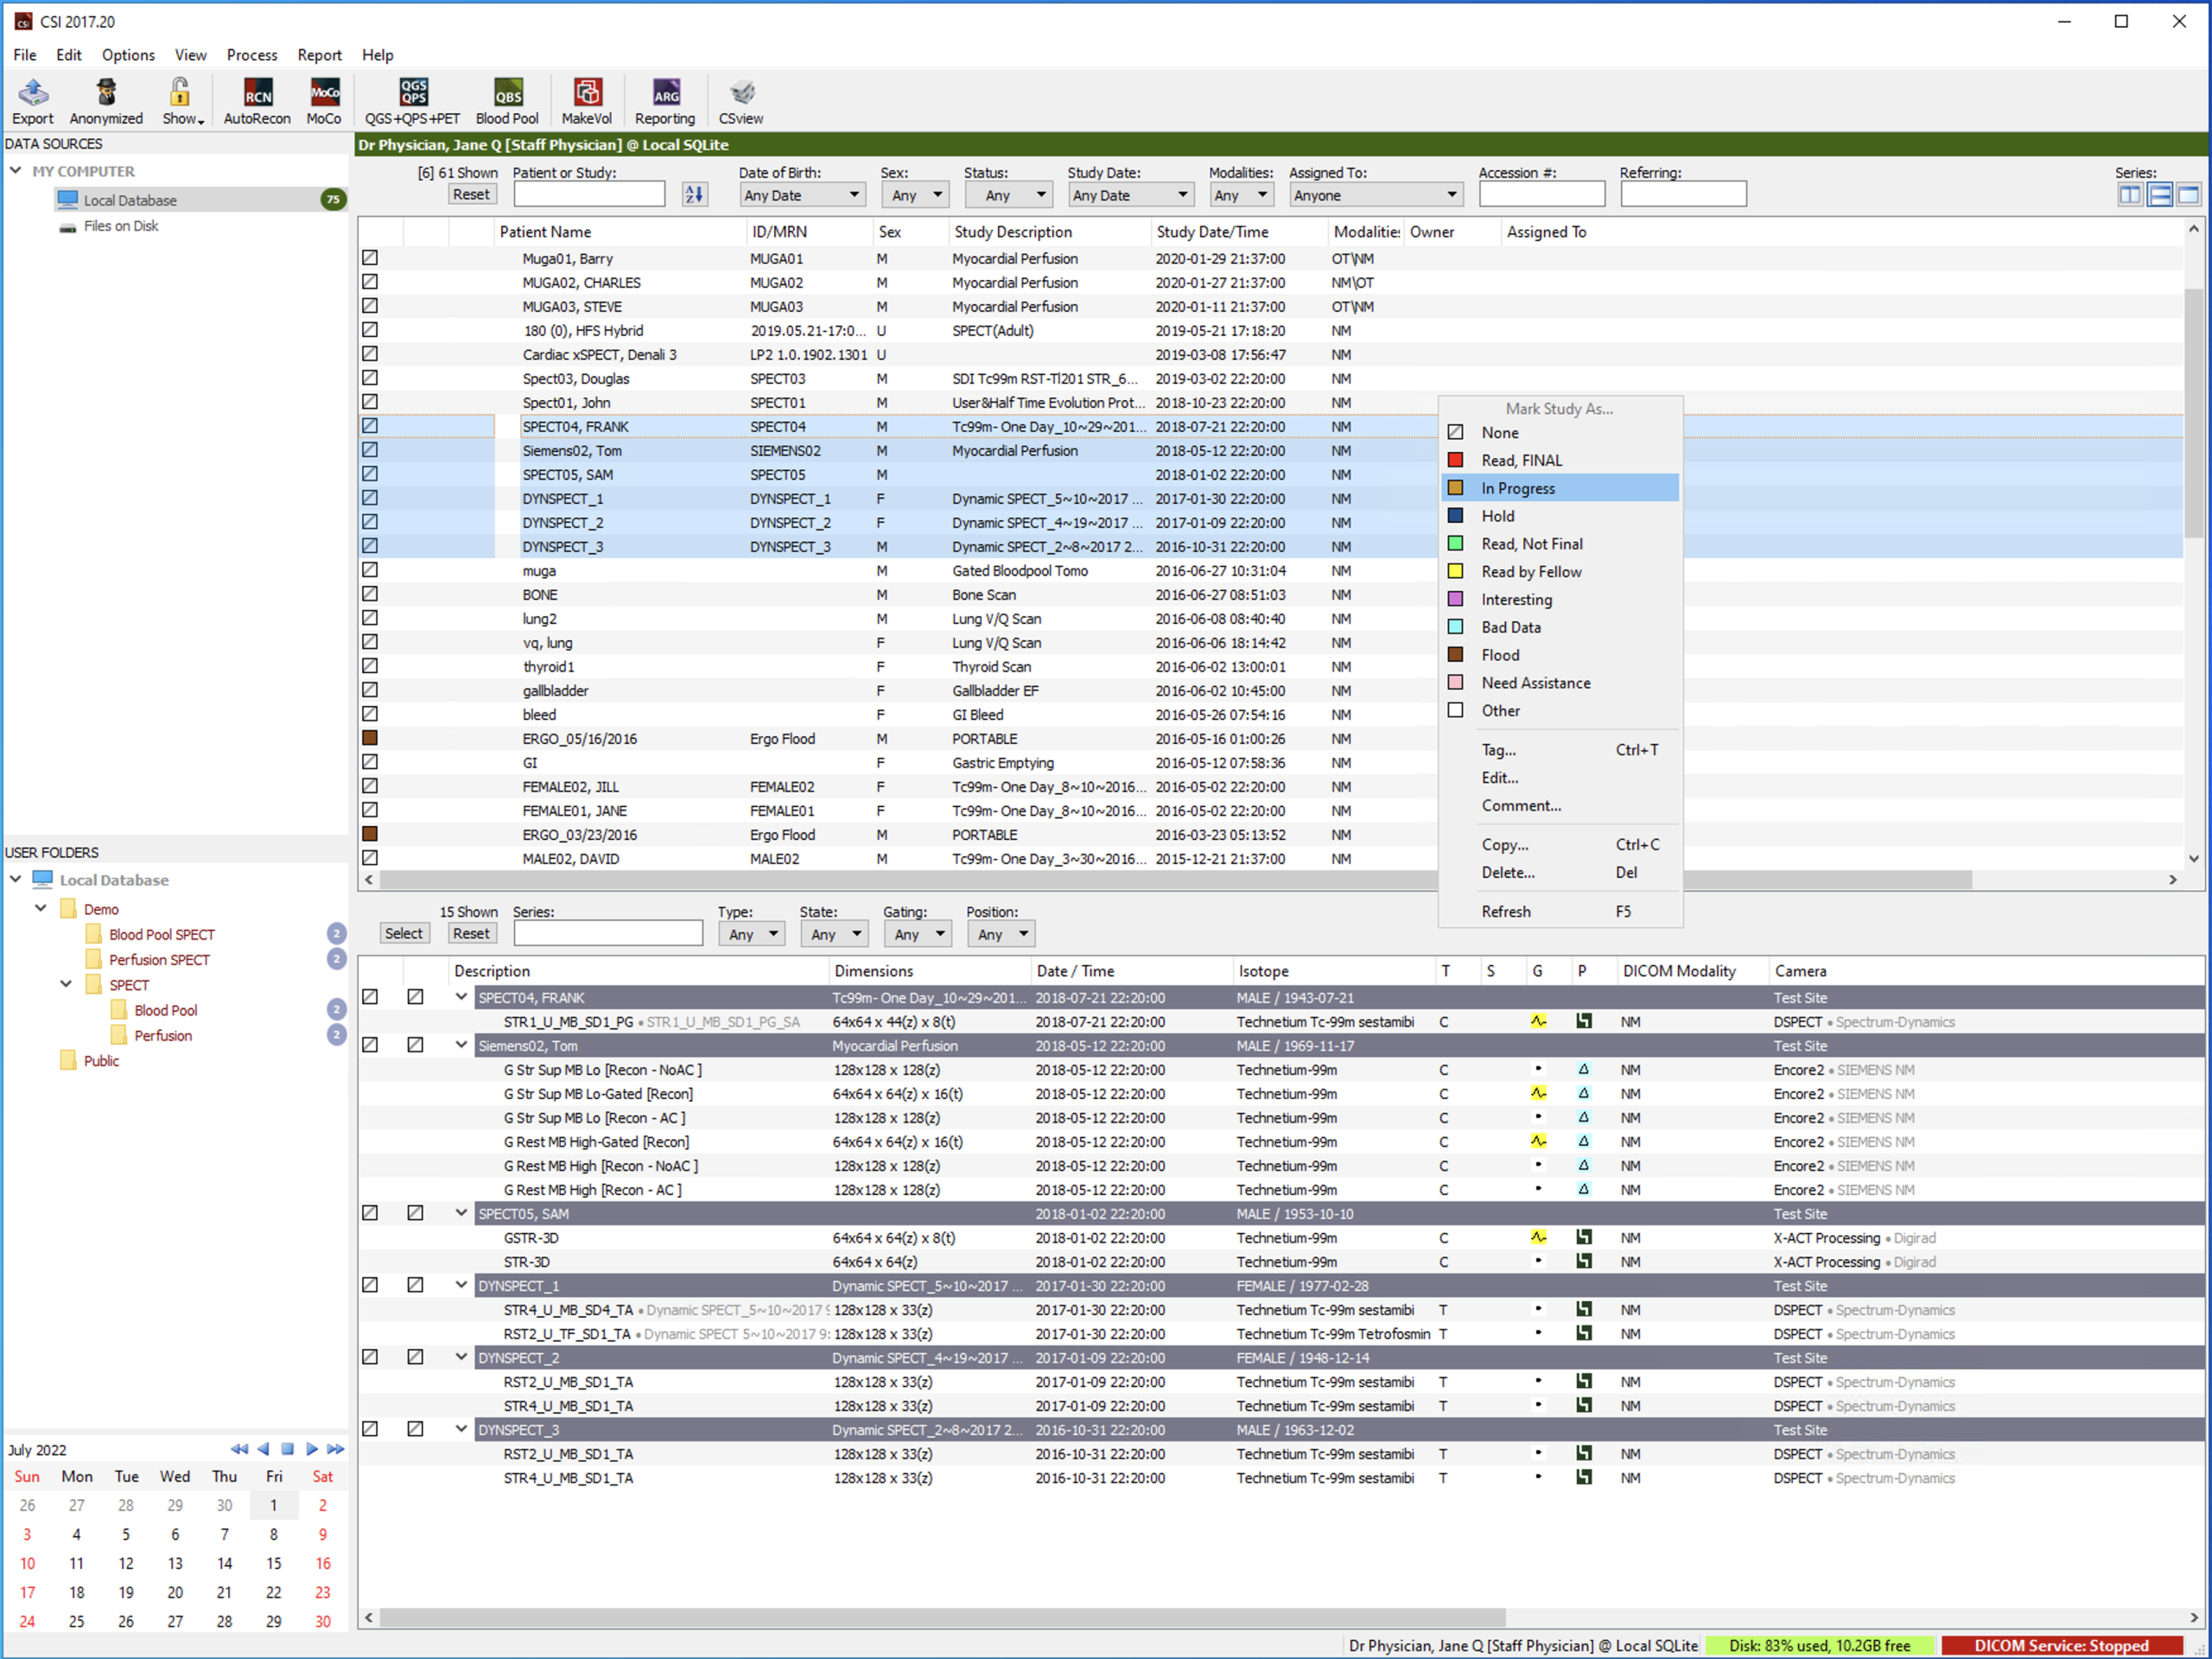
CSI, aka CSImport, allows you to transfer studies and manages the datasets on your computer. CSI 2017 (going back to version 2013) has a database architecture that provides lightning-fast searching across all your studies. Powerful tagging allows you to organize your data however you’d like without data duplication. CSI supports pulling data from DICOM Query/Retrieve servers but also FTP servers as well as legacy systems such as ADAC Pegasus and Marconi Odyssey systems. CSI also allows DICOM cameras and workstations to push data to your computer, and can import data from CDs or other removable media or from a network share. One-click anonymized mode hides patient identification so you can use the software in interactive lectures.
CSI Server
While the single-system, standalone version of CSI is designed for use by multiple users on the same computer, but not necessarily concurrently, the CSI Server product is based on Microsoft SQL Server and allows concurrent access by a large number of users. The system, developed and in daily use at Cedars-Sinai Health System, handles hundreds of thousands of studies gracefully, making it an ideal nuclear cardiology solution for even the largest of sites. And since both CSI and CSI Server have support for multiple sites, large sites that also read for other acquisition locations are ready to go. Interested in CSI Server? Contact us so we can discuss your needs and design a solution that matches them.CSview - Image Viewer
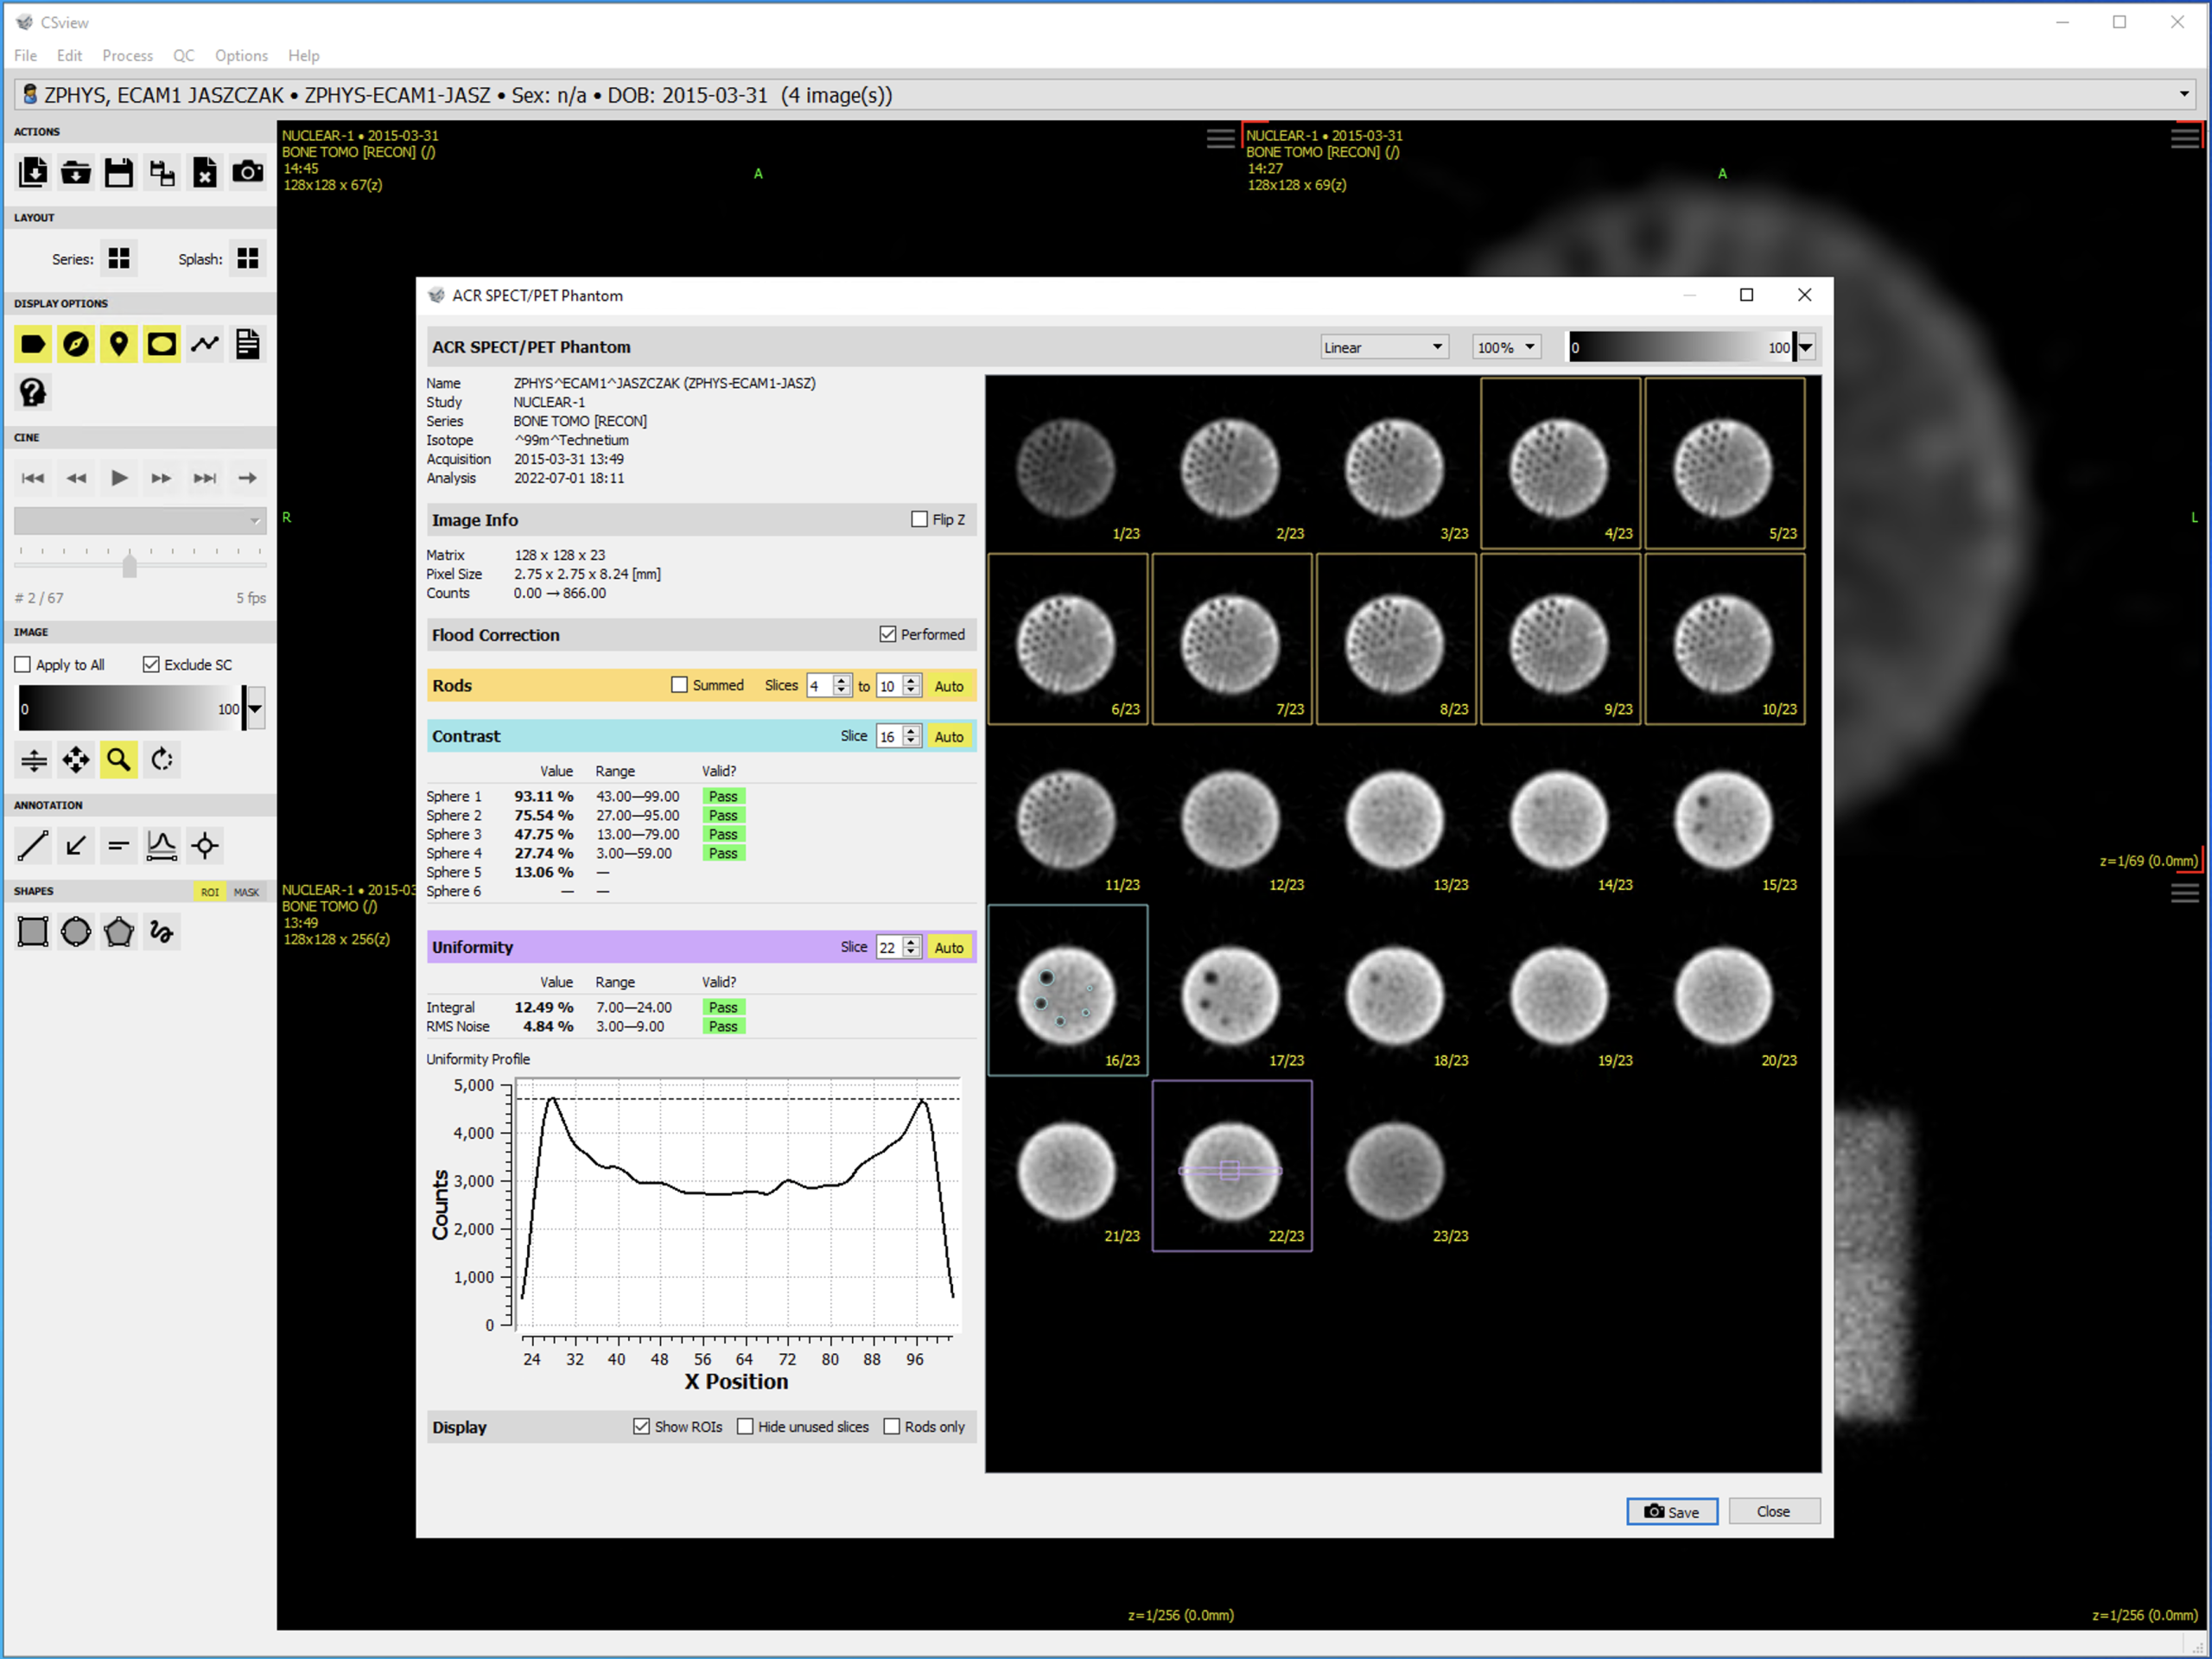
CSview is the latest addition to Cardiac Suite. A general 2D image viewer, CSview provides basic manipulation and processing of images such as ROI calculations and measurements.
CSview also provides QC tools for SPECT and PET cameras. Specifically, it includes automated NEMA flood uniformity processing and ACR Jaszczak phantom analysis.
Request A Quote
Interested in purchasing the Cedars-Sinai Cardiac Suite?
Fill out a Quote Request
Call +1-844-CSMC-AIM
(844-276-2246), press 1 for Sales
Email sales@csaim.com